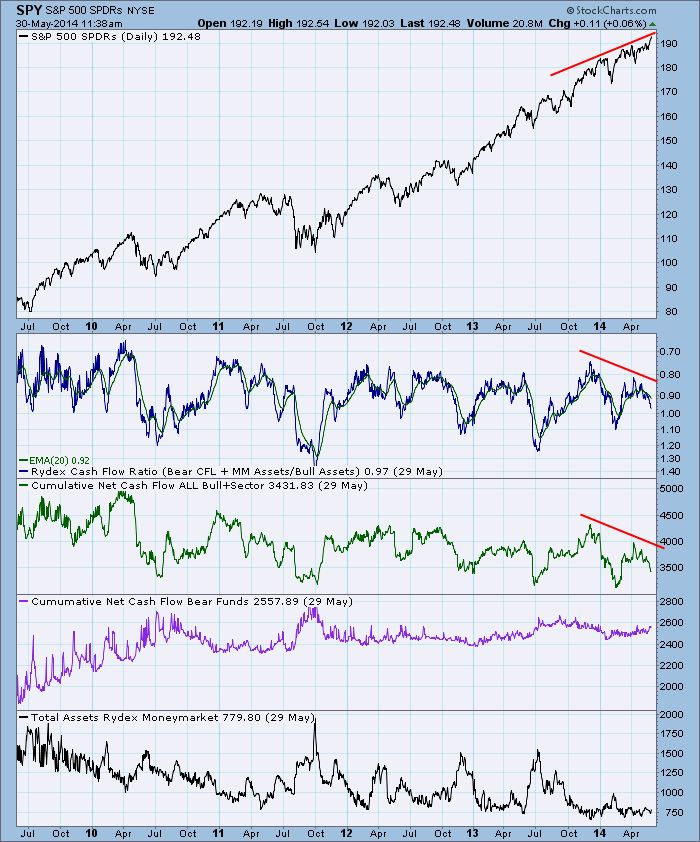
We calculate and chart daily and cumulative net cash flow, which is the actual cash entering and leaving each fund in the Rydex group of funds. This is done by calculating the amount that total assets in a fund should have changed based upon the percentage change of per share net asset value (NAV), assuming that no cash was added to or taken out of the fund. We then subtract this amount from the actual amount of total assets in the fund, and the result is the daily net cash flow. We keep a cumulative total of the daily net cash flow. Total asset value tells us how much money is in the fund. Cumulative Cash Flow tells us how much cash was actually moved in or out of the fund. The Rydex Cash Flow Ratio gives a different view of sentiment extremes by using cumulative cash flow (CCFL) into Rydex mutual funds rather than using the totals of assets in those funds (which we use for the Rydex Asset Ratio). It is calculated by dividing Money Market plus Bear Funds CCFL by Bull Funds plus Sector Funds CCFL.
Currently, there is a negative divergence between rising price and the Cash Flow Ratio. The source of this divergence is evident in the panel directly below the Ratio, Cumulative Net Cash Flow All Bull plus Sector Funds, which tells us that cash is flowing out of bull funds. This is likely to result in a price correction soon.
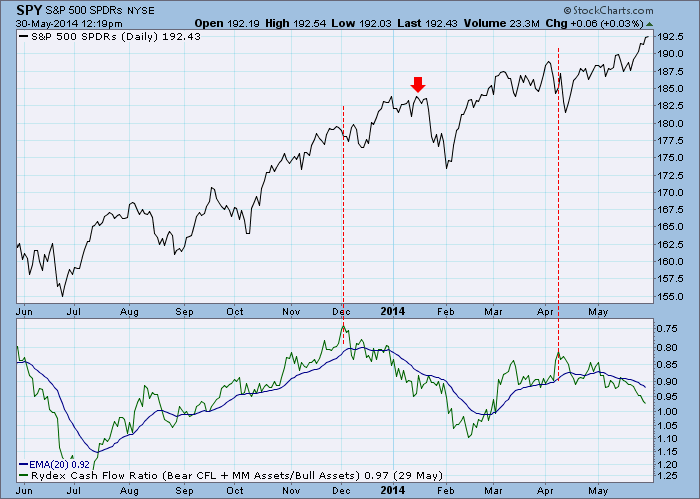
While price peaks and Ratio peaks most often coincide, there can be a delay between the Ratio peak and the uptimate price correction. Note that after the Ratio peak in December the coresponding correction didn't occur until several weeks later. And, while there was a bit of chop associated with the Ratio peak in April, Cash Flow has continued to deteriorate and is most likely undermining the current rally.
Conclusion: Positive cash flow is necessary to maintain rising prices, and the current divergence between cash flow and price will most likely result in a price correction.


