I noticed on today's DP ETF Tracker Report, where ETFs are sorted by percent change, that Gold Miners hit it big today. Gold Miner ETFs and stocks, while tied to gold, will not necessarily trade and travel with gold prices. However, as of late they have been dropping just like gold. I was surprised to see that both ETFs I looked at had recently tested support near or at all-time lows. Can they go lower? Or are they ready for a turnaround? Let's take a look.
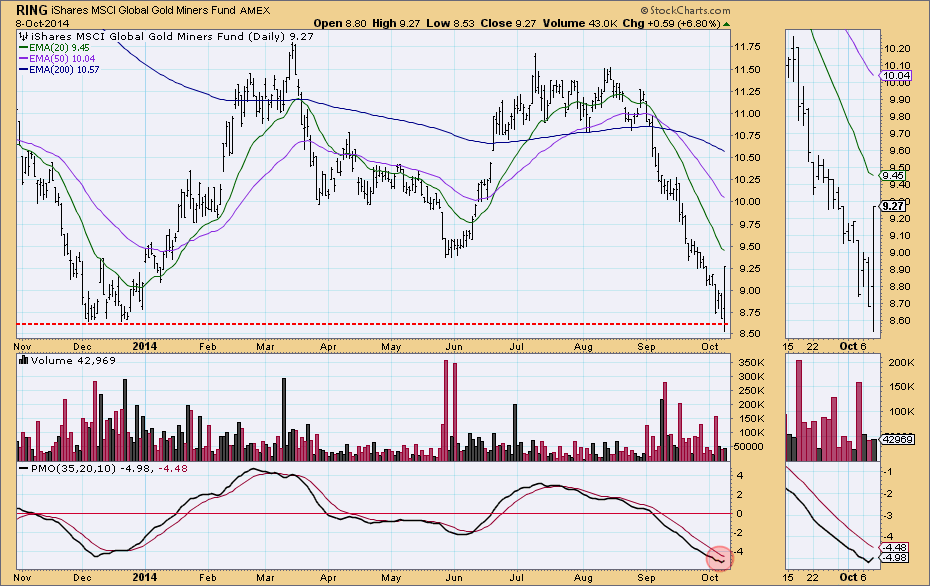
I'm going to start with iShares Gold Miners ETF, RING (I love that symbol!). On the daily chart we see that horizontal support was broken at the December 2013 low which also happens to be an all-time low. Today price posted an all-time intraday low before it rebounded. That large positive move shifted momentum and caused the Price Momentum Oscillator (PMO) to bottom and prepare for a positive crossover its EMA. This bottom occurred in deeply oversold territory. This could be a major price bottom. However, the concerns are that the 50-EMA is well-below the 200-EMA which implies RING is in a serious bear market. The 20-EMA crossed below the 50-EMA back in August while it was above the 200-EMA so a Trend Model Neutral signal is in play. The EMAs are definitely configured negatively and just because it has experienced all-time price lows, doesn't mean it can't go lower.
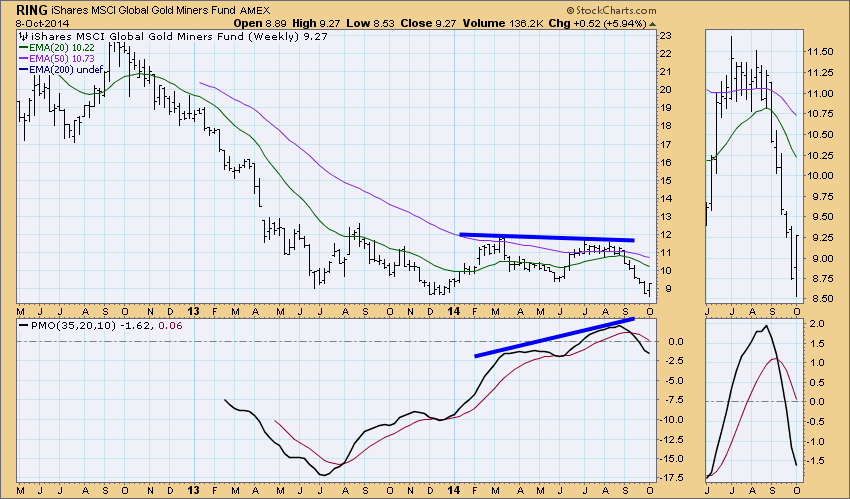
On the weekly chart, the weekly PMO is declining out of overbought territory, but it is slowing down. I noticed that there was a positive divergence between price and the PMO tops. Again, I temper my excitement because the EMAs are configured negatively.
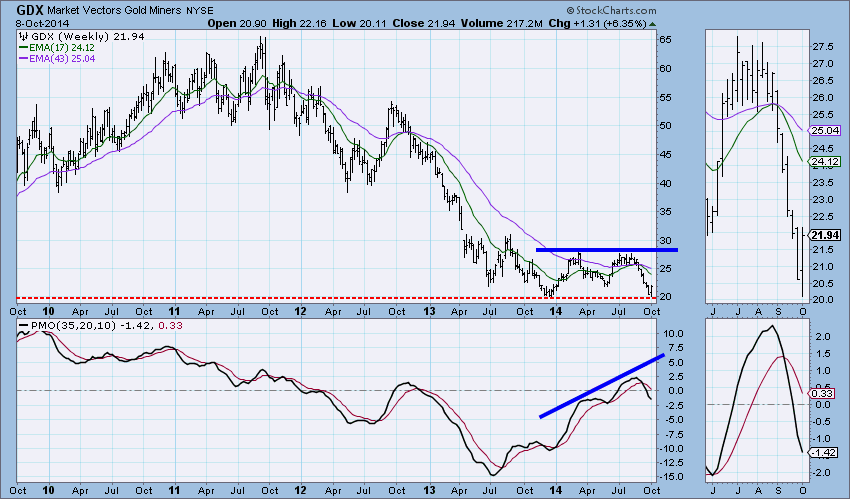
Let's look at GDX, the Market Vectors ETF. The daily chart is very similar, price has bounced off of horizontal support and it broke out of a steep declining trend channel. The PMO has turned up in oversold territory. Unfortunately, the EMAs are configured negatively just like RING above.
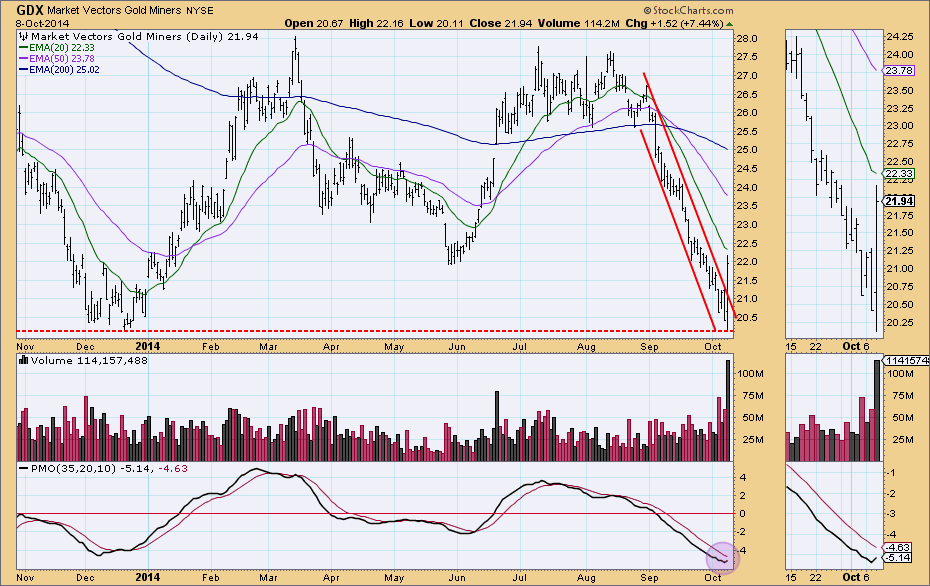
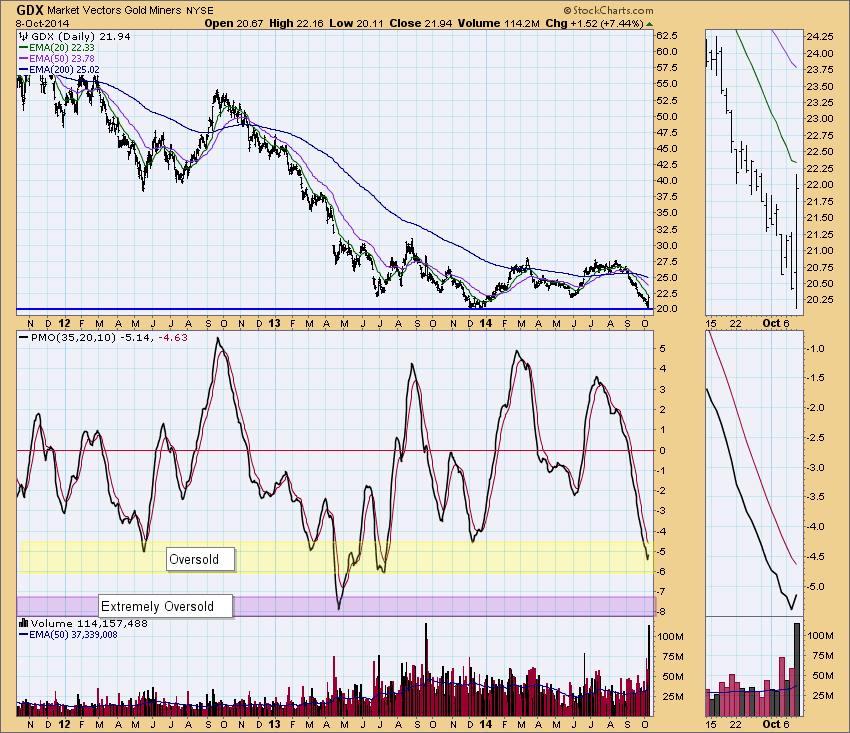
How oversold is the PMO? I stretched out the time frame, and we see that the PMO could actually get more oversold. But a bottom in this territory is still bullish.
The weekly chart shows us a positive divergence with the PMO, just like RING.
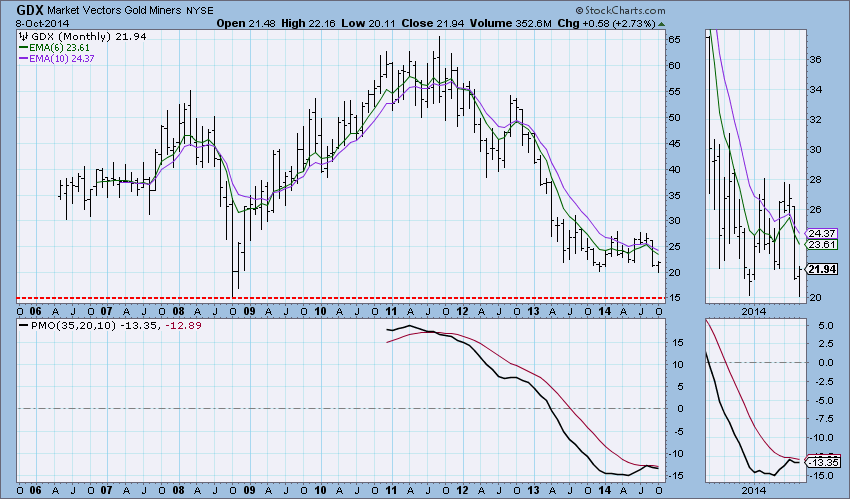
However, note on the monthly chart, price has not hit all-time lows yet, price could definitely go lower on GDX. The monthly PMO appears to be turning up.
A caveat: PMO positive divergences like we see on the weekly charts above, are less credible when a stock or ETF is in a bear market. When a stock or ETF is in a bear market, "bear market rules apply". This means don't expect bullish outcomes in a bear market. I would tread very carefully on these ETFs. They are on my 'watch' list.
Happy Charting!
Erin
