We have some longer-term indicators that we like because they are derived from price movement, rather than breadth or volume. They have a finite range (0-100) and reflect the percentage of index component stocks in a particular status. For almost two years they have stayed at unusually high levels, never becoming really oversold, and this was quite abnormal. Currently, the market is engaged in a somewhat normal correction (only -6.9% so far), and the internals, as reflected by these indicators, are showing the associated internal stress.
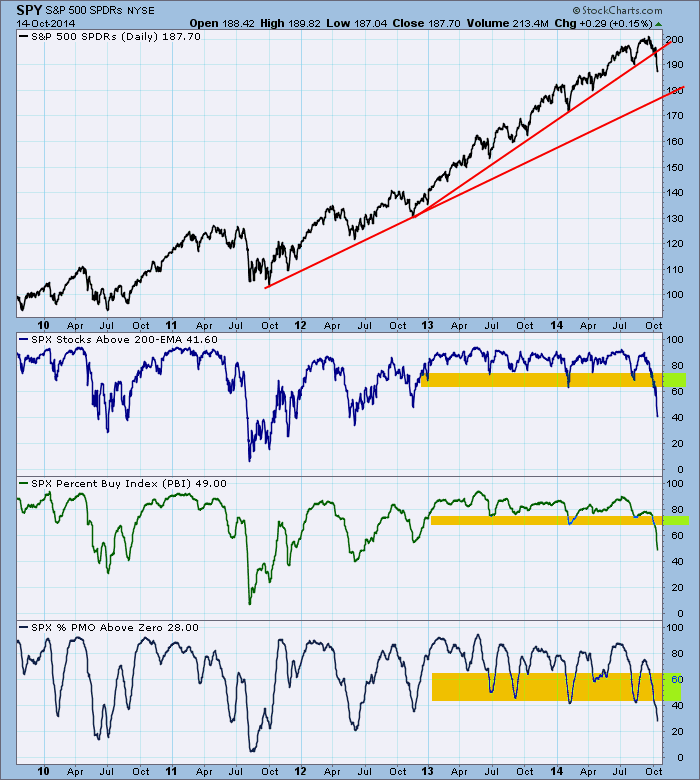
Percent of Stocks Above Their 200EMA: When a stock's price is below its 200EMA, it is considered to be bearish. Only 42% of S&P 500 stocks are bullish by being above their 200EMA.
Percent Buy Index (PBI): This shows the percentage of S&P 500 stocks that are on Price Momentum Model BUY signals. Currently only 49% meet this criteria.
Percent PMOs Above Zero: When a stock's PMO is above the zero line, its internals are considered to be positive. Only 28% of S&P 500 stocks pass this test.
Conclusion: These indicators are finally dipping into territory that reflects a more normal correction, and it is a good thing to see the market moving away from the unreal, fairy tale demeanor it has displayed for too long. For nearly two years there has been "buy the dip" talk, but there hasn't been a dip worth buying--that is to say there haven't been sufficiently oversold readings. Whether this dip will be a buying opportunity remains to be seen, but at least we are seeing some internals that make it worth consideration.


