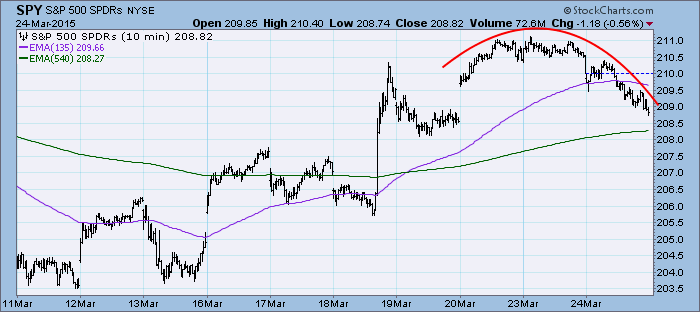
Since reaching and nearly capturing all-time highs, price has been declining. The rounded top on the 10-minute bar chart is clear and implies price will continue lower. There is an area of support nearby at the 3/19 low, but I believe that will be taken out quickly.
The purpose of the DecisionPoint Daily Update is to quickly review the day's action, internal condition, and Trend Model status of the broad market (S&P 500), the nine SPDR Sectors, the U.S. Dollar, Gold, Crude Oil, and Bonds. To ensure that using this daily reference will be quick and painless, we are as brief as possible, and often we let a chart speak for itself.
SIGNALS: Here we include the current day's signal table, an excerpt from the DecisionPoint Alert Daily Report.
DECISIONPOINT ALERT DAILY REPORT
Tuesday, 3/24/2015

************************ DECISIONPOINT MARKET POSTURE ***********************

The following is the market posture suggested by our mechanical trend-
following tools. These are not trading recommendations, rather they are price
activity flags that should be qualified by chart analysis. The Trend Model is
used on all indexes.


                                     Days   Index     03/24   Points  Percent
Index               Posture     Date Elap  @Start     Close      P/L      P/L
------------------- ------- -------- ---- -------   -------  -------  -------
Stocks Medium-Term  Bullish 10/31/14  144   199.66   208.82    +9.16    +4.6%
Stocks Long-Term    Bullish 10/31/14  144   199.66   208.82    +9.16    +4.6%
Gold (NY Spot)      Bearish 02/23/15   29  1200.80  1191.40    +9.40    +0.8%
20+Yr T-Bond  (TLT) Bullish 03/19/15    5   130.82   132.62    +1.80    +1.4%
------------------- ------- -------- ---- -------   -------  -------  -------
Dollar Index  (UUP) Bullish 07/21/14  246    21.47    25.62    +4.15   +19.3%
Commodities   (GSG) Neutral 07/14/14  253    32.64    19.65     ....     ....
Crude Oil     (USO) Neutral 07/30/14  237    36.92    16.79     ....     ....
------------------- ------- -------- ---- -------   -------  -------  -------
S&P 500       (SPY)     BUY 10/31/14  144   199.66   208.82    +9.16    +4.6%
S&P Equal Wt  (RSP)     BUY 11/03/14  141    77.46    81.61    +4.15    +5.4%
Dow           (DIA)     BUY 02/03/15   49   175.55   179.83    +4.28    +2.4%
Nasdaq 100    (QQQ)     BUY 10/29/14  146    99.21   107.94    +8.73    +8.8%
NDX Equal Wt (QQEW)     BUY 10/30/14  145    40.52    44.61    +4.09   +10.1%
S&P 100       (OEF)     BUY 02/04/15   48    89.96    92.10    +2.14    +2.4%
S&P 400 MidCp (IJH)     BUY 11/05/14  139   141.11   153.04   +11.93    +8.5%
S&P 600 SmlCp (IJR)     BUY 11/03/14  141   110.95   119.74    +8.79    +7.9%
Total Market  (VTI)     BUY 11/03/14  141   103.53   108.99    +5.46    +5.3%
Consumer Disc (XLY)     BUY 11/05/14  139    67.05    76.24    +9.19   +13.7%
Cons Disc EWt (RCD)     BUY 11/03/14  141    82.41    92.20    +9.79   +11.9%
Consumer Stpl (XLP)     BUY 08/20/14  216    44.00    48.74    +4.74   +10.8%
Cons Stpl EWt (RHS)     BUY 10/21/14  154    97.26   106.69    +9.43    +9.7%
Energy        (XLE)    SELL 03/05/15   19    77.65    76.13    +1.52    +2.0%
Energy EWt    (RYE)    SELL 03/06/15   18    65.36    64.71    +0.65    +1.0%
Financial     (XLF)     BUY 02/13/15   39    24.34    24.37    +0.03    +0.1%
Financial EWt (RYF)     BUY 02/05/15   47    44.13    45.03    +0.90    +2.0%
Health Care   (XLV)     BUY 10/23/14  152    63.89    74.04   +10.15   +15.9%
Health Cr EWt (RYH)     BUY 05/09/14  319   115.73   157.45   +41.72   +36.0%
Industrial    (XLI)     BUY 10/30/14  145    54.12    56.45    +2.33    +4.3%
Industrl EWt  (RGI)     BUY 02/09/15   43    88.54    90.54    +2.00    +2.3%
Materials     (XLB)     BUY 02/05/15   47    49.85    49.07    -0.78    -1.6%
Materials EWt (RTM)     BUY 02/03/15   49    84.99    86.36    +1.37    +1.6%
Technology    (XLK)     BUY 02/09/15   43    40.87    42.40    +1.53    +3.7%
Technolgy EWt (RYT)     BUY 02/05/15   47    89.42    93.34    +3.92    +4.4%
Utilities     (XLU) Neutral 02/20/15   32    45.33    44.51     ....     ....
Utilities EWt (RYU) Neutral 02/25/15   27    75.94    74.71     ....     ....

Average                               103                               +6.9%
NOTE: Mechanical trading model signals define the implied bias of the price index based upon moving average relationships, but they do not necessarily call for a specific action. They are information flags that should prompt chart review. Further, they do not call for continuous buying or selling during the life of the signal. For example, a BUY signal will probably return the best results if action is taken soon after the signal is generated. Additional opportunities for buying may be found as price zigzags higher, but the trader must look for optimum entry points. Conversely, exit points to preserve gains (or minimize losses) may be evident before the model mechanically closes the signal.
STOCKS: Based upon a 10/31/2014 Trend Model BUY signal, our current intermediate-term market posture for the S&P 500 (SPY) is bullish. The Trend Model, which informs our long-term outlook, is on a BUY signal as of 10/31/2014 so our long-term posture is bullish.
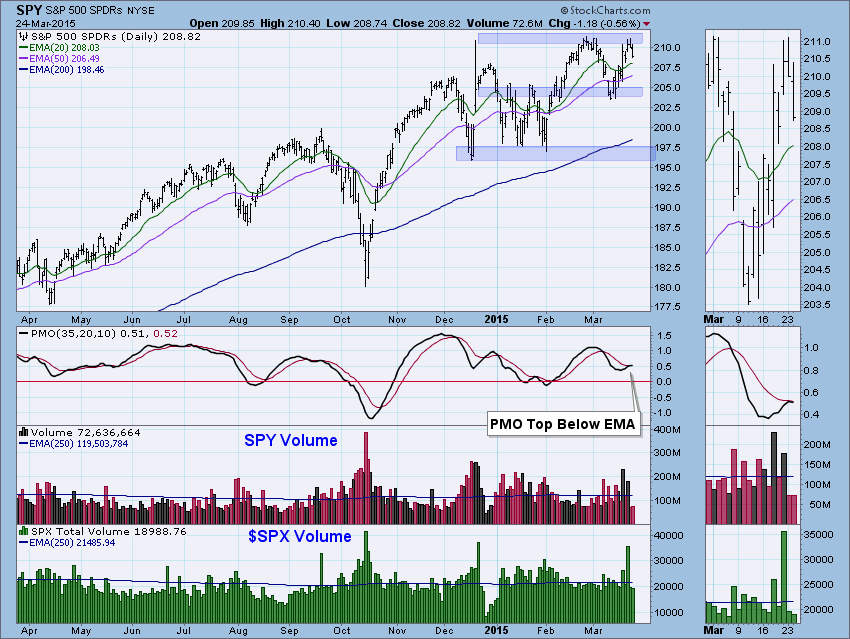
The daily chart is looking more and more bearish. Price hit resistance and immediately turned back down. Not only did resistance hold, but notice that the PMO turned down below its EMA. That is extremely bearish, especially given price's failure to break through resistance.
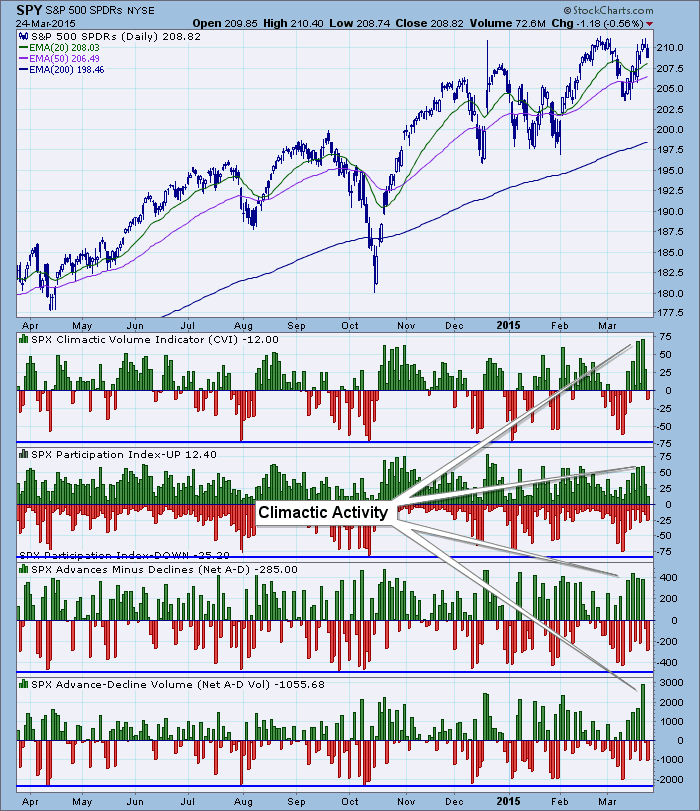
Ultra-Short-Term Indicators: I've marked the recent high readings as "climactic". I note that when the first high readings appeared they were an ultra-short-term initiation impulse that told us to expect more upside. The last very high reading was an exhaustion climax. It marked a possible ultra-short-term price top which we got. Now readings are average and are not giving us any read on direction or force.
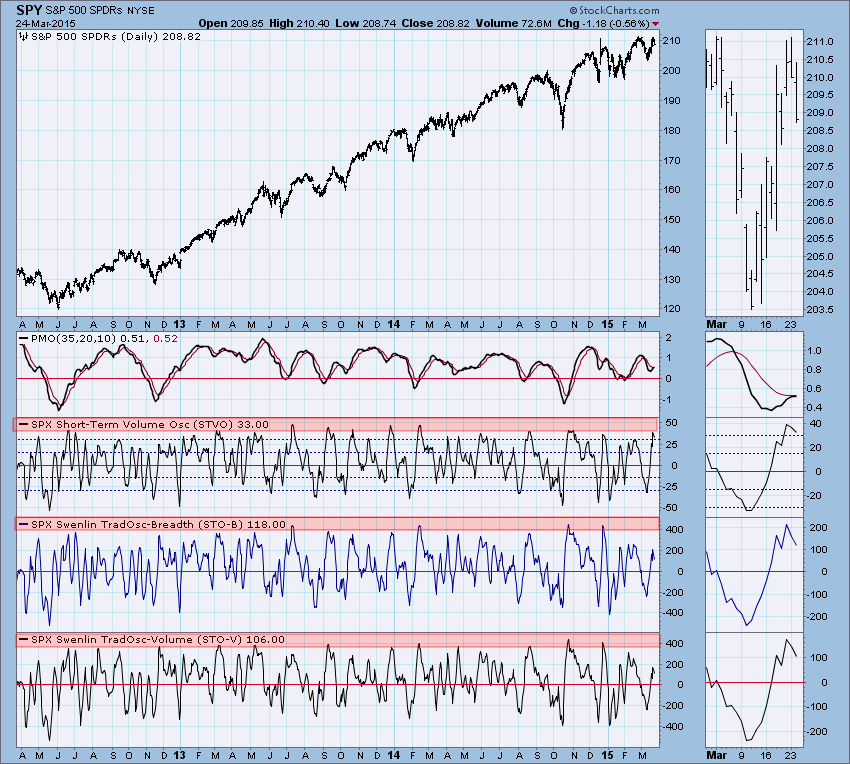
Short-Term Indicators: For the second time in this price rally, short-term indicators topped. It appears this top will 'stick'. It occurred in somewhat overbought territory just before a price top and has held on.
Intermediate-Term Indicators: The ITBM had only just crossed above its EMA when it topped and nearly crossed back below the EMA today. The ITVM avoided this fate since it never was able to cross its EMA. The VTO is still rising but appears to be topping. Any time a reading tops below its EMA, it is considered very bearish.
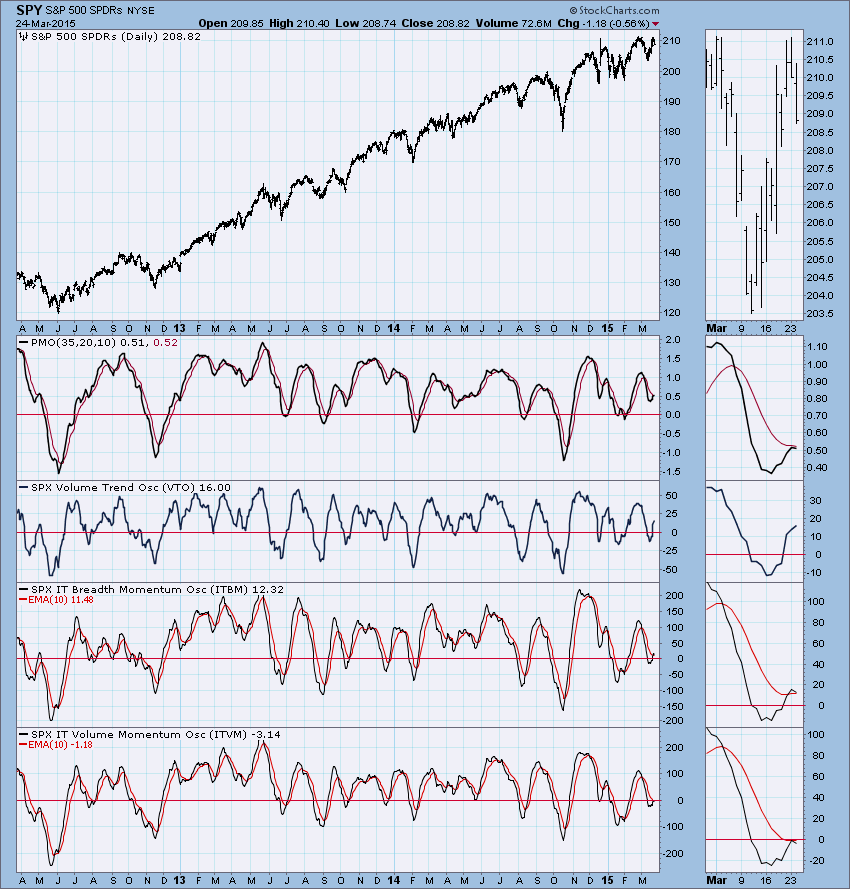
Conclusion: Price hit the ceiling at the all-time highs and backed off. Indicators in all three time frames are neutral to bearish to very bearish which, of course suggests that we shouldn't expect a bullish outcome. I'll only whisper it now, "Could that be a double-top forming?"
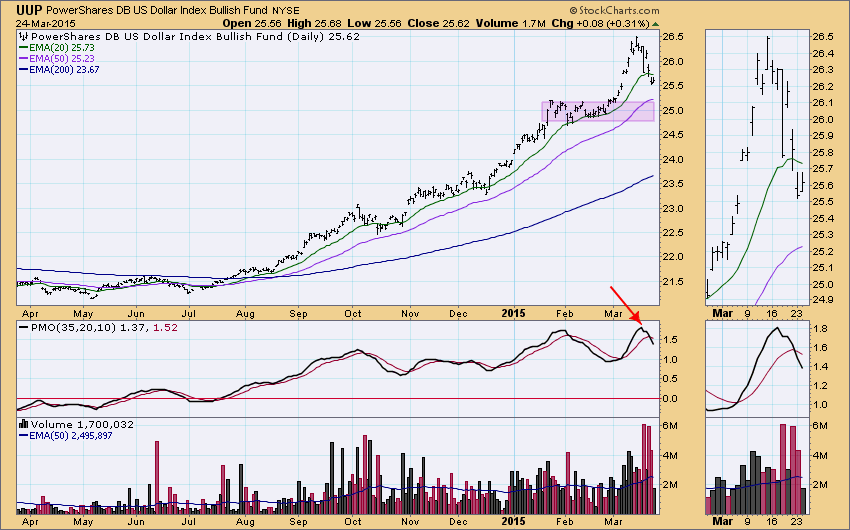
DOLLAR: As of 7/21/2014 the US Dollar Index ETF (UUP) is on a Trend Model BUY signal. The LT Trend Model, which informs our long-term outlook, is on a BUY signal as of 8/21/2014, so our long-term posture is bullish.
The dollar put the breaks on its recent slide to likely pause the steep decline. Since we saw a recent PMO crossover SELL signal and I don't see any real support until Jan/Feb price highs. Volume was subdued today on the bounce which also tells me there is more downside likely.
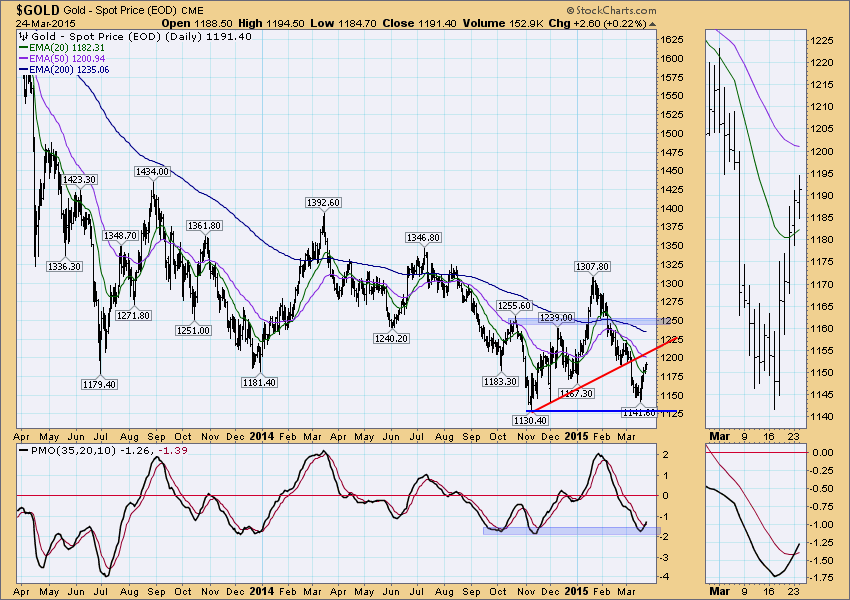
GOLD: As of 2/23/2015 Gold is on a Trend Model SELL signal. The LT Trend Model, which informs our long-term outlook, is on a SELL signal as of 2/15/2013, so our long-term posture is bearish.
Gold was up today even on a rising dollar which suggests some internal strength. The PMO crossed over its EMA today generating a PMO BUY signal on gold. The PMO is in oversold territory, not near extremes, but in a popular support zone at -2. Let's see if it can break back above the rising bottoms line, after that is resistance at the October 2014 high.
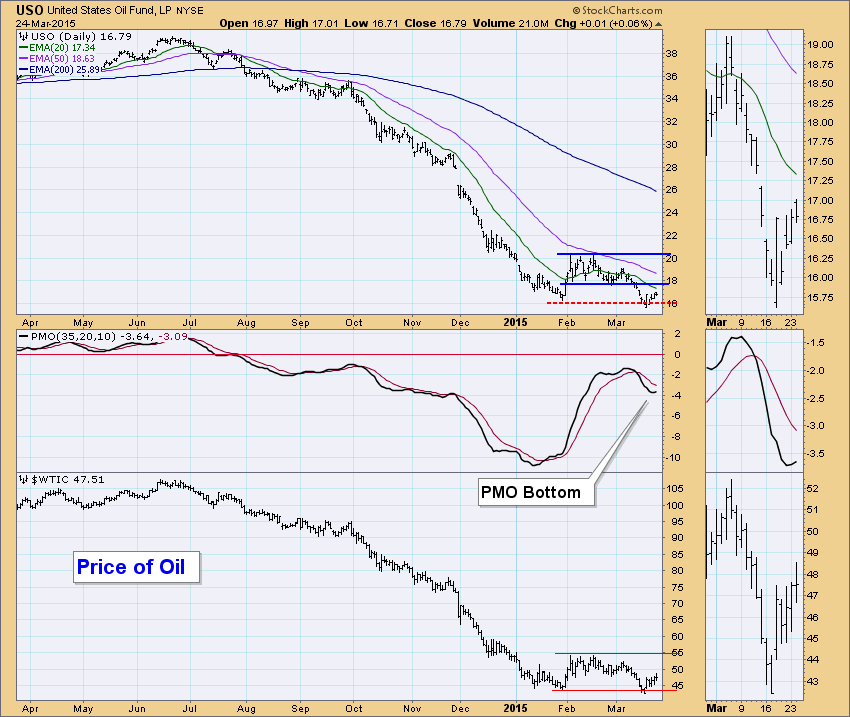
CRUDE OIL (USO): As of 7/30/2014 United States Oil Fund (USO) is on a Trend Model NEUTRAL signal. The LT Trend Model, which informs our long-term outlook, is on a SELL signal as of 8/28/2014, so our long-term posture is bearish.
The PMO bottomed last week on USO suggesting more upside price potential. Price then began to slowly climb. There are a few problems for USO right now: Resistance is looming at 18 and the PMO bottom didn't come from oversold territory.
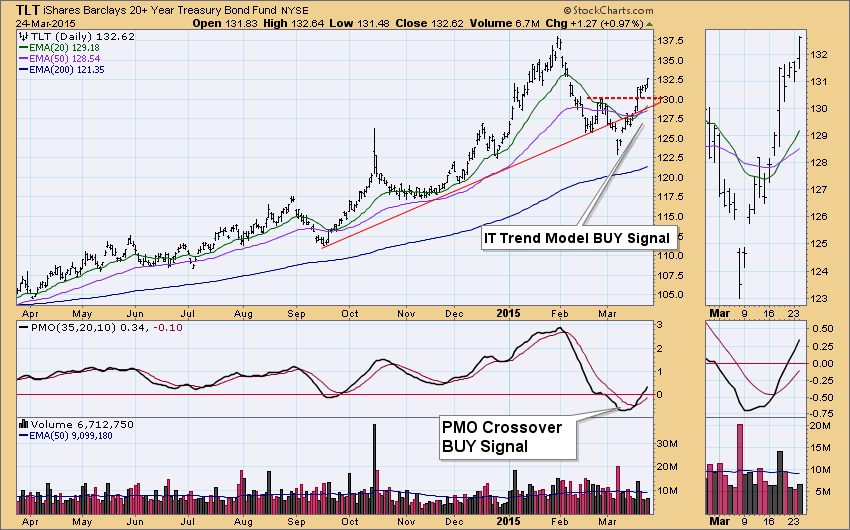
BONDS (TLT): As of 3/19/2015 The 20+ Year T-Bonds ETF (TLT) is on a Trend Model BUY signal. The LT Trend Model, which informs our long-term outlook, is on a BUY signal as of 3/24/2014, so our long-term posture is bullish.
Bonds are back on top as price broke above resistance at the late February top. Next test will be resistance at the all-time highs.
Technical Analysis is a windsock, not a crystal ball.
Happy Charting!
- Erin


