 I was asked a question recently about how we can use the Price Momentum Oscillator (PMO) in conjunction with the Trend Model or which do I rely on most when making investment decisions. In a general sense, I prefer to use the PMO with Trend Model confirmations or positive Trend Model configurations with bullish PMO moves.
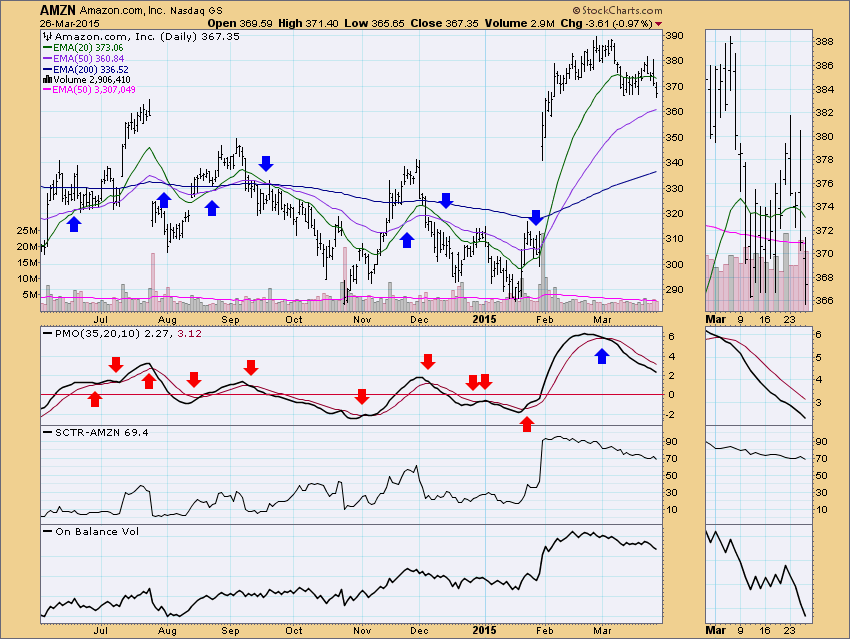
If you have a buy and hold strategy, I think the Intermediate-Term Trend Model works to your advantage. There are fewer crossovers in comparison to the PMO and hence fewer needs to reevaluate your positions. There are far more PMO crossovers than Trend Model crossovers. Notice in the example below for Amazon, the PMO has many crossovers whereas the Trend Model does not.
If you get really ambitious, you could develop an alert on the stocks in your portfolio or on potential candidates that would notify you when crossovers occur. A sample alert for a 20/50-EMA positive crossover when the 50-EMA is above the 200-EMA on Amazon (AMZN) is below:
[symbol = 'AMZN']
and [today's ema(20,close) > today's ema(50,close)] and [yesterday's ema(20,close) <= yesterday's ema(50,close)]
and [today's ema(200,close) < today's ema(50,close)]
There is a great blog article here on creating alerts.
If you have a short-term or swing trader approach, using the PMO crossovers or bottoms/tops in conjunction with certain Trend Model configurations is probably your best bet. One thing you will also notice is that the PMO nearly always gives the first signal. Also the most successful PMO signals are the ones that occur at the top or the bottom of the range. This is one of the main reasons you want to use all signals as information flags that invite you to check out the chart. A scan that will notify you when the PMO has a positive crossover while the 20/50/200-EMAs are bullishly configured on a member of the Consumer Staples Sector is below:
[group is ConsumerStaplesSector]
AND[today's PMO Line(35,20,10)>today's PMO Signal(35,20,10)]
AND [yesterday's PMO Line(35,20,10) < yesterday's PMO Signal(35,20,10)]
AND [today's ema(20,close) > today's ema(50,close)]
AND [today's ema(50,close) > today's ema(200,close)]
This scan yielded one chart today from the Consumer Staples sector and it is below.
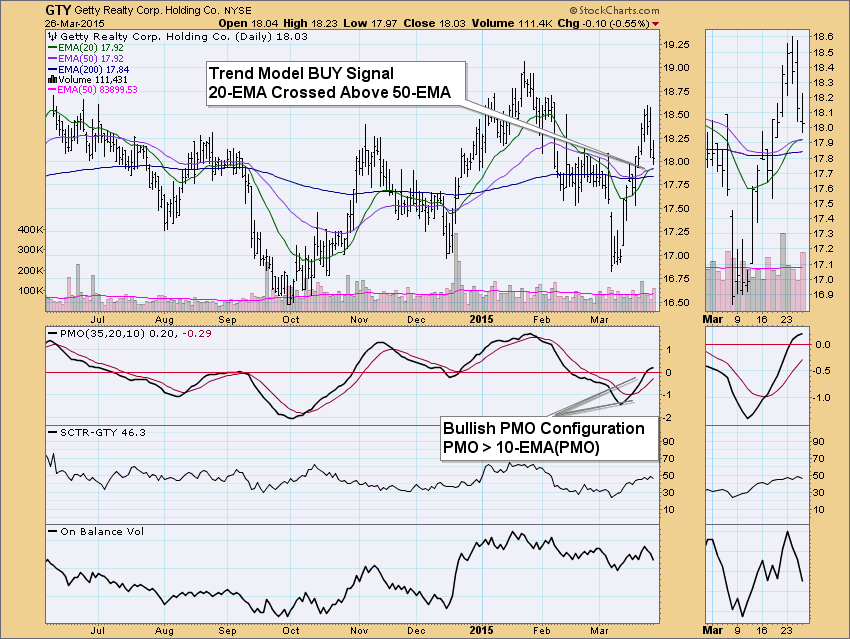
A conservative approach would be to be alerted when a Trend Model positive crossover occurs while the PMO is above its signal line. This alert tells you that the Trend Model has confirmed any previous PMO crossovers. Here is a sample alert for the Financial Sector:
[Group is FinancialSector]
and [PMO Line(35,20,10) > PMO Signal(35,20,10)]
and [today's ema(20,close) > today's ema(50,close)] and [yesterday's ema(20,close) <= yesterday's ema(50,close)]
This scan generated three charts. Below is Getty Realty Corp. Holding Co. (GTY):
There are many many ways to use the Trend Model and PMO together. I didn't even review using the Short-Term Trend Model with the PMO, although a previous article does. Note also, that these alerts can be made into scans if you prefer to not use an alert system.
Happy Charting!
Erin


