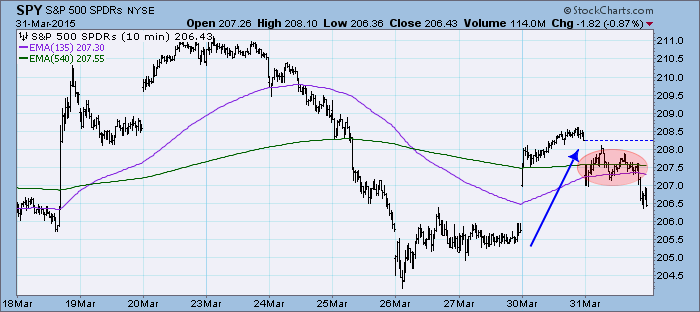
After consolidating the correction last week, price rebounded on Monday, but it was over today as price stayed in the red all day. It consolidated in negative territory, but the end of the day price saw price fall back down and out of that area of congestion. Interestingly, you can see a double-top in that area that executed in textbook fashion, dropping price the length of the pattern once the neckline was broken.
The purpose of the DecisionPoint Daily Update is to quickly review the day's action, internal condition, and Trend Model status of the broad market (S&P 500), the nine SPDR Sectors, the U.S. Dollar, Gold, Crude Oil, and Bonds. To ensure that using this daily reference will be quick and painless, we are as brief as possible, and often we let a chart speak for itself.
SIGNALS: Here we include the current day's signal table, an excerpt from the DecisionPoint Alert Daily Report.
DECISIONPOINT ALERT DAILY REPORT
Tuesday, 3/31/2015

************************ DECISIONPOINT MARKET POSTURE ***********************

The following is the market posture suggested by our mechanical trend-
following tools. These are not trading recommendations, rather they are price
activity flags that should be qualified by chart analysis. The Trend Model is
used on all indexes.


                                     Days   Index     03/31   Points  Percent
Index               Posture     Date Elap  @Start     Close      P/L      P/L
------------------- ------- -------- ---- -------   -------  -------  -------
Stocks Medium-Term  Bullish 10/31/14  151   199.66   206.43    +6.77    +3.4%
Stocks Long-Term    Bullish 10/31/14  151   199.66   206.43    +6.77    +3.4%
Gold (NY Spot)      Bearish 02/23/15   36  1200.80  1183.20   +17.60    +1.5%
20+Yr T-Bond  (TLT) Bullish 03/19/15   12   130.82   130.69    -0.13    -0.1%
------------------- ------- -------- ---- -------   -------  -------  -------
Dollar Index  (UUP) Bullish 07/21/14  253    21.47    25.96    +4.49   +20.9%
Commodities   (GSG) Neutral 07/14/14  260    32.64    19.50     ....     ....
Crude Oil     (USO) Neutral 07/30/14  244    36.92    16.84     ....     ....
------------------- ------- -------- ---- -------   -------  -------  -------
S&P 500       (SPY)     BUY 10/31/14  151   199.66   206.43    +6.77    +3.4%
S&P Equal Wt  (RSP)     BUY 11/03/14  148    77.46    81.05    +3.59    +4.6%
Dow           (DIA)     BUY 02/03/15   56   175.55   177.58    +2.03    +1.2%
Nasdaq 100    (QQQ)     BUY 10/29/14  153    99.21   105.60    +6.39    +6.4%
NDX Equal Wt (QQEW)     BUY 10/30/14  152    40.47    43.80    +3.33    +8.2%
S&P 100       (OEF)     BUY 02/04/15   55    89.49    90.26    +0.77    +0.9%
S&P 400 MidCp (IJH)     BUY 11/05/14  146   140.67   151.98   +11.31    +8.0%
S&P 600 SmlCp (IJR)     BUY 11/03/14  148   110.56   118.03    +7.47    +6.8%
Total Market  (VTI)     BUY 11/03/14  148   103.05   107.25    +4.20    +4.1%
Consumer Disc (XLY)     BUY 11/05/14  146    67.05    75.35    +8.30   +12.4%
Cons Disc EWt (RCD)     BUY 11/03/14  148    82.41    91.64    +9.23   +11.2%
Consumer Stpl (XLP)     BUY 08/20/14  223    44.00    48.74    +4.74   +10.8%
Cons Stpl EWt (RHS)     BUY 10/21/14  161    97.26   107.94   +10.68   +11.0%
Energy        (XLE)    SELL 03/05/15   26    77.65    77.58    +0.07    +0.1%
Energy EWt    (RYE)    SELL 03/06/15   25    65.36    65.93    -0.57    -0.9%
Financial     (XLF)     BUY 02/13/15   46    24.34    24.11    -0.23    -0.9%
Financial EWt (RYF)     BUY 02/05/15   54    44.13    44.56    +0.43    +1.0%
Health Care   (XLV)     BUY 10/23/14  159    63.89    72.50    +8.61   +13.5%
Health Cr EWt (RYH)     BUY 05/09/14  326   115.73   155.22   +39.49   +34.1%
Industrial    (XLI)     BUY 10/30/14  152    54.12    55.77    +1.65    +3.0%
Industrl EWt  (RGI)     BUY 02/09/15   50    88.54    89.89    +1.35    +1.5%
Materials     (XLB) Neutral 03/27/15    4    48.61    48.78     ....     ....
Materials EWt (RTM)     BUY 02/03/15   56    84.99    85.63    +0.64    +0.8%
Technology    (XLK)     BUY 02/09/15   50    40.87    41.44    +0.57    +1.4%
Technolgy EWt (RYT)     BUY 02/05/15   54    89.42    91.90    +2.48    +2.8%
Utilities     (XLU) Neutral 02/20/15   39    45.33    44.43     ....     ....
Utilities EWt (RYU) Neutral 02/25/15   34    75.94    74.25     ....     ....

Average                               108                               +6.1%
NOTE: Mechanical trading model signals define the implied bias of the price index based upon moving average relationships, but they do not necessarily call for a specific action. They are information flags that should prompt chart review. Further, they do not call for continuous buying or selling during the life of the signal. For example, a BUY signal will probably return the best results if action is taken soon after the signal is generated. Additional opportunities for buying may be found as price zigzags higher, but the trader must look for optimum entry points. Conversely, exit points to preserve gains (or minimize losses) may be evident before the model mechanically closes the signal.
STOCKS: Based upon a 10/31/2014 Trend Model BUY signal, our current intermediate-term market posture for the S&P 500 (SPY) is bullish. The Trend Model, which informs our long-term outlook, is on a BUY signal as of 10/31/2014 so our long-term posture is bullish.
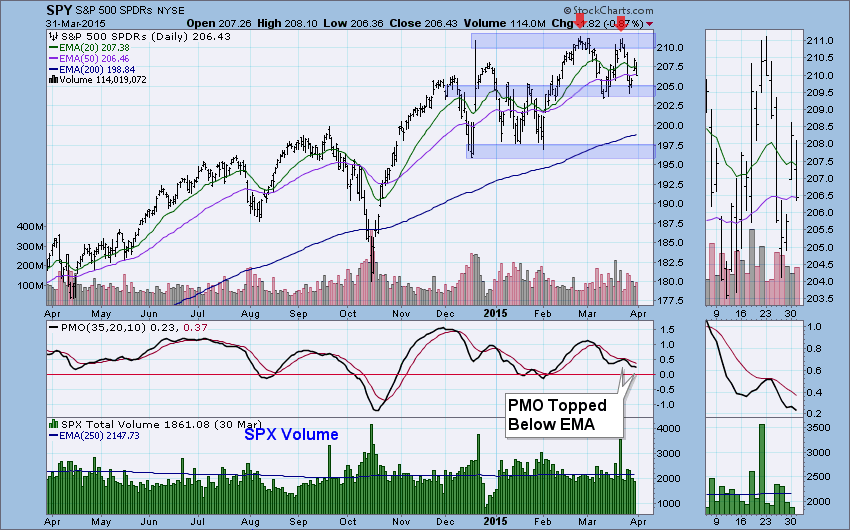
It looked like price might form a double-bottom, but with today's decline and the gap up that wasn't covered, I suspect we've seen the last of upside movement until support at last March lows is tested again. The PMO had slowed and even bottomed briefly, but today it resumed its decline, forming a second top below its EMA which is very bearish.
Ultra-Short-Term Indicators: Nothing interesting to report here. Participation - DOWN was elevated but nothing unusual for trading like today's.
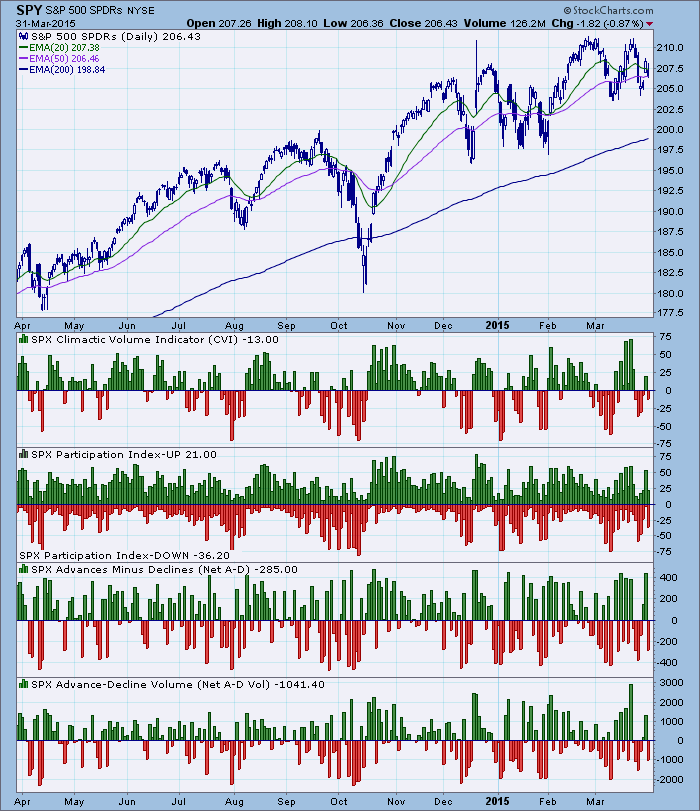
Short-Term Indicators: The STO-B and STO-V have been rising which is bullish. The STVO hasn't been swayed by the small rally yesterday and is still pointed down which is bearish.

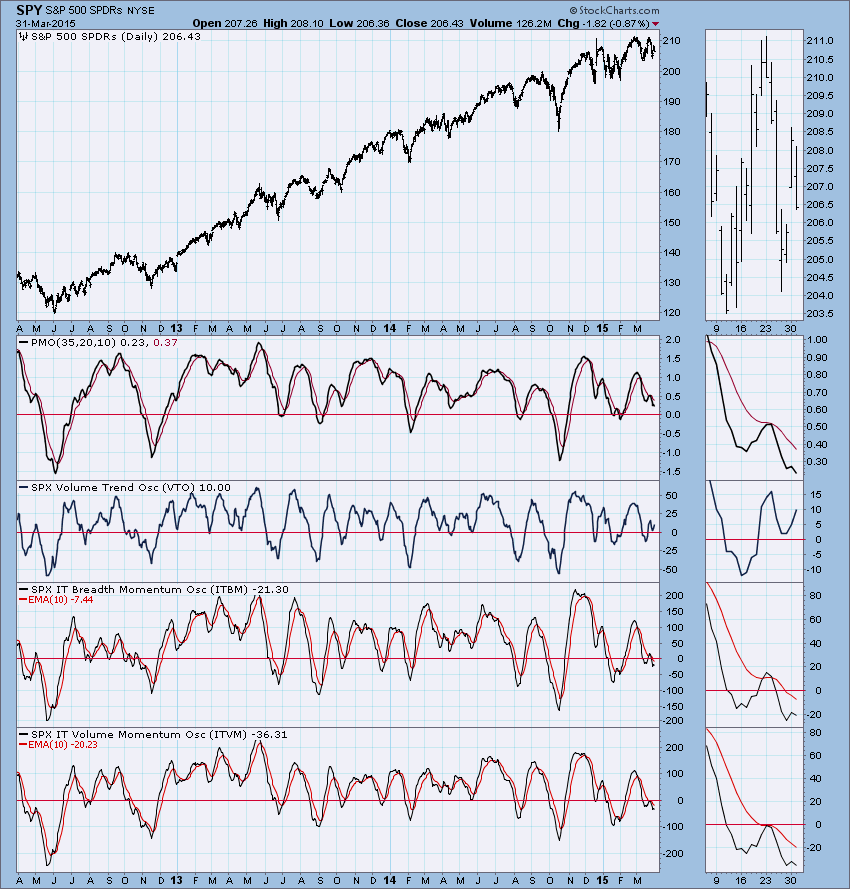
Intermediate-Term Indicators: Readings on the ITBM and ITVM topped below their EMA which is very negative. They are sitting in an area where we have seen price rebounds/bounces occur, but it would be much better if they moved lower before making a solid reversal.
Conclusion: Price movement is starting to resemble the rocky moves of last January. Indicators are sending some mixed signals. Short-term indicators are somewhat bullish while intermediate-term indicators are bearish. I would lean to the bearish side given the second top below the zero line on the PMO. Putting more weight on intermediate-term conditions which are bearish is the most prudent.
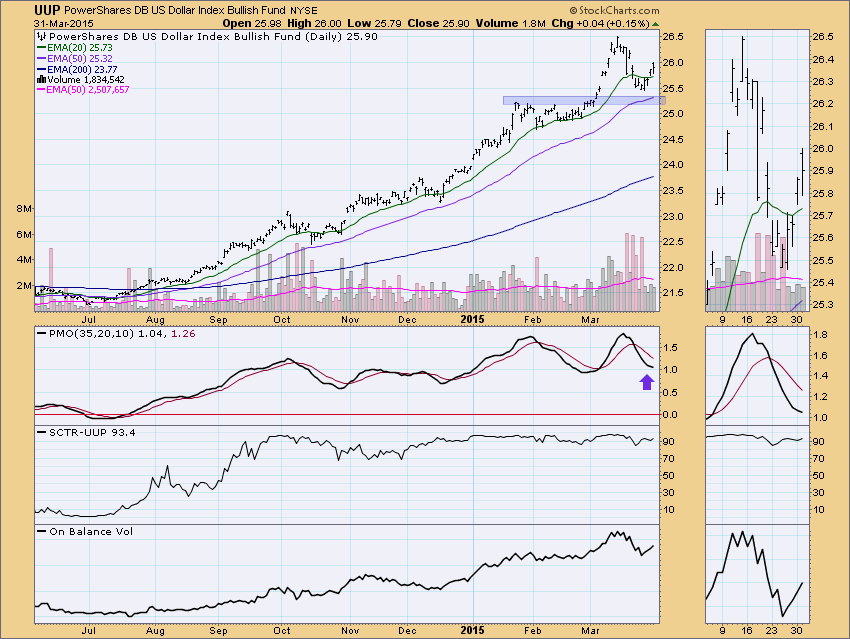
DOLLAR: As of 7/21/2014 the US Dollar Index ETF (UUP) is on a Trend Model BUY signal. The LT Trend Model, which informs our long-term outlook, is on a BUY signal as of 8/21/2014, so our long-term posture is bullish.
It appeared the dollar had run out of steam as it declined to test support. However, it managed to bottom before reaching support which is bullish. Additionally, price was able to get back above the 20-EMA yesterday and followed-through today by staying there and finishing the day up. Despite the rally, the PMO has continued to decline, which is a negative divergence. The PMO is now slowing down and may be ready to bottom.
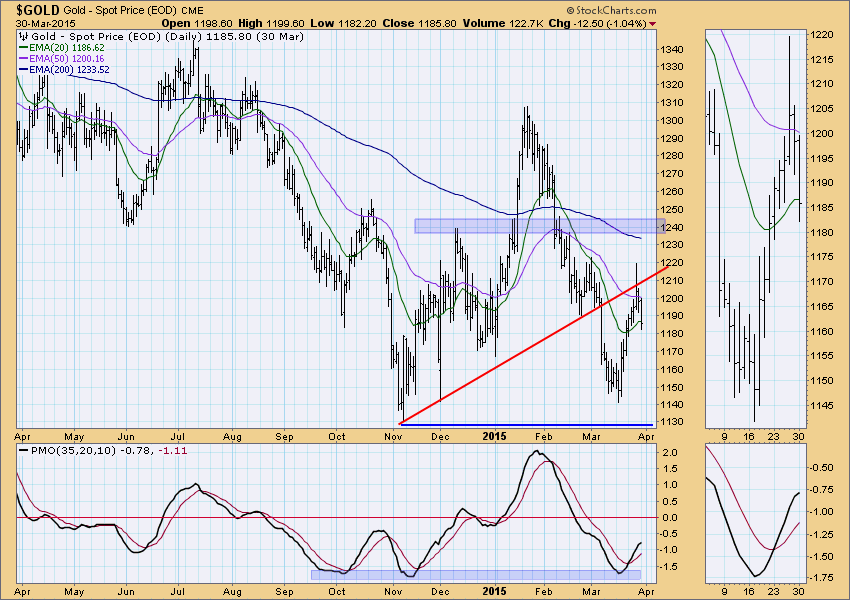
GOLD: As of 2/23/2015 Gold is on a Trend Model SELL signal. The LT Trend Model, which informs our long-term outlook, is on a SELL signal as of 2/15/2013, so our long-term posture is bearish.
Gold reached the rising bottoms trend line and turned right back down. The PMO is topping. With the dollar gaining its strength back, we should see gold test support again.
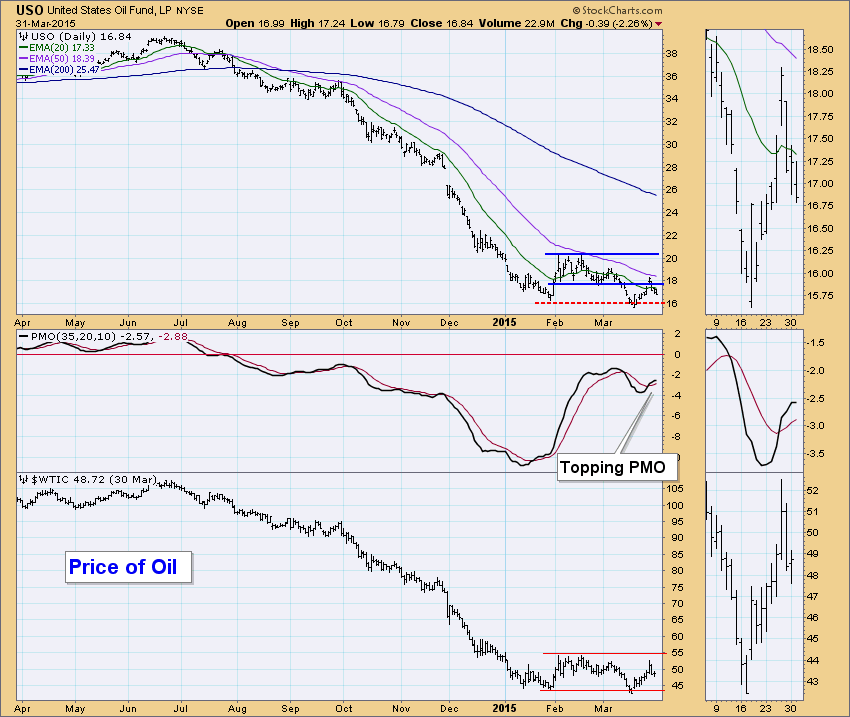
CRUDE OIL (USO): As of 7/30/2014 United States Oil Fund (USO) is on a Trend Model NEUTRAL signal. The LT Trend Model, which informs our long-term outlook, is on a SELL signal as of 8/28/2014, so our long-term posture is bearish.
USO reached overhead resistance and failed to hold the breakout. Fortunately support at the all-time low is close and could form a strong foundation. A topping PMO below the zero line does leave us vulnerable to a breakdown below support.
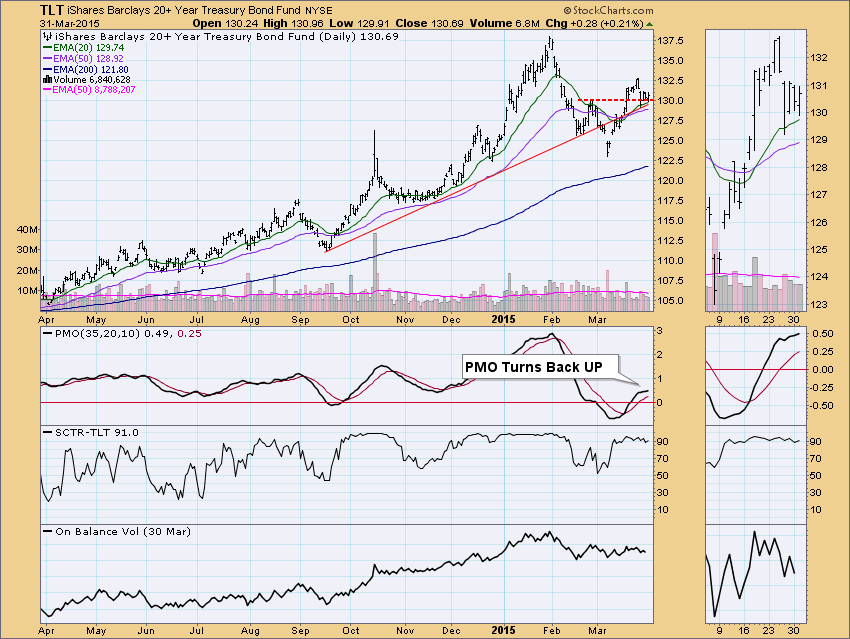
BONDS (TLT): As of 3/19/2015 The 20+ Year T-Bonds ETF (TLT) is on a Trend Model BUY signal. The LT Trend Model, which informs our long-term outlook, is on a BUY signal as of 3/24/2014, so our long-term posture is bullish.
Bonds began to consolidate after price reached both the support line and rising bottoms trend line. Both are holding which is positive and the PMO is starting to trend up, albeit at a snail's pace. It's still a positive divergence since price is moving sideways.
Technical Analysis is a windsock, not a crystal ball.
Happy Charting!
- Erin


