I have always been a fan of equal-weighted indexes as opposed to capitalization-weighted indexes because equal-weighted indexes generally give us more bang for the buck. The reason is that cap-weighted indexes weight the constituents based upon their market capitalization; whereas, equal-weighted indexes give each constituent an equal weight in the index. For example, the S&P 500's fifty-nine largest stocks (12% of the 500 stocks) compose 50% of the total market capitalization of the index, so those top fifty-nine stocks will have an inordinate influence on the daily percentage change of the index. With an equal-weighted index, such as the Guggenheim S&P 500 Equal Weighted ETF (RSP), each component is held in equal dollar amounts (rebalanced quarterly), and, of course, each stock will have an equal influence on the daily change of the index. This means that the smaller-cap stocks, which often perform better than the large-cap stocks, can improve the performance of the index.
The following chart illustrates the point pretty well. Note that from the 2009 low to the present, SPY, which tracks the cap-weighted S&P 500, advanced +252% versus +343% for RSP, the equal weighted ETF. RSP out-performed SPY by +36%, which demonstrate the power of smaller-cap stocks in a bull market.
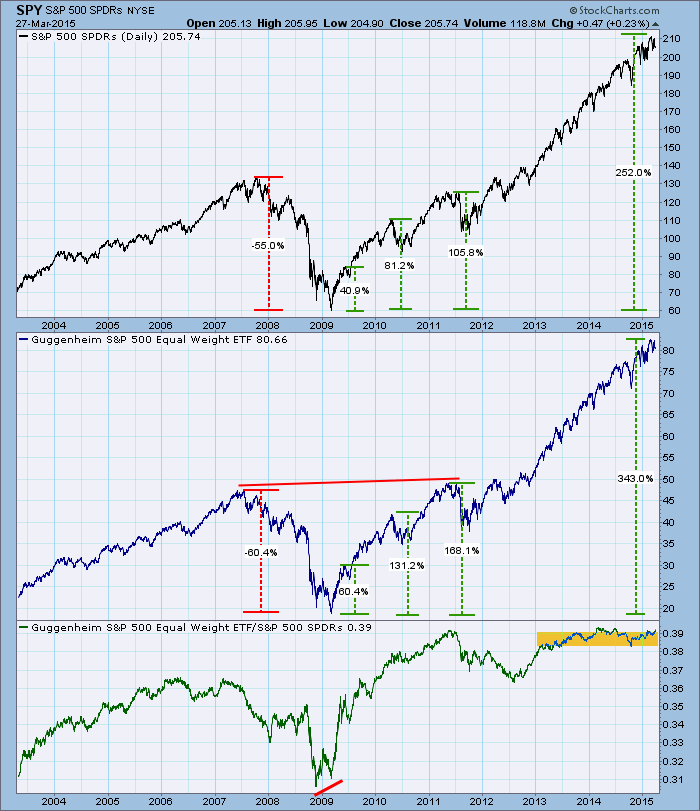
While those stats might make us want to stay with the equal-weight ETF exclusively, we have to remember that small-cap stocks perform poorly in bear markets, and we can see that RSP lost 10% more than SPY in the 2007-2009 bear market, so we need to beware of extended periods of decline, or remember that equal-weight indexes predominantly move faster in both directions.
The bottom panel on the chart is a relative strength line (RSP divided by SPY). At the bear market low, note that there was a positive divergence on the relative strength line. Then notice how RSP out-performed SPY by up to +50% on the three up legs I have annotated. Finally, we can see that the relative strength line has been moving sideways for the last two years. What this tells us is that money has been less favorable to smaller-cap stocks than to large-cap stocks, and that there has been little difference between the two indexes during that time.
In the DecisionPoint Alert Daily Report we track the cap-weighted and equal-weighted versions of the major market indexes (when available) and the nine S&P 500 sectors. Below is the latest report to show how they are presented. Unfortunately, it is not a very good demonstration of comparative performance because of the extended sideways price movement I mentioned, plus the current signals are mostly short term in duration because of the October correction.
DECISIONPOINT ALERT DAILY REPORT
Friday, 3/27/2015

************************ DECISIONPOINT MARKET POSTURE *************************************

The following is the market posture suggested by our mechanical trend-
following tools. These are not trading recommendations, rather they are price
activity flags that should be qualified by chart analysis. The Trend Model is
used on all indexes.


                                     Days   Index     03/27   Points  Percent   Prev Signal
Index               Posture     Date Elap  @Start     Close      P/L      P/L     P/L  Days
------------------- ------- -------- ---- -------   -------  -------  ------- ------- -----
S&P 500       (SPY)     BUY 10/31/14  147   199.66   205.74    +6.08    +3.0%
S&P Equal Wt  (RSP)     BUY 11/03/14  144    77.46    80.66    +3.20    +4.1%
Dow           (DIA)     BUY 02/03/15   52   175.55   176.81    +1.26    +0.7%
Nasdaq 100    (QQQ)     BUY 10/29/14  149    99.21   105.52    +6.31    +6.4%
NDX Equal Wt (QQEW)     BUY 10/30/14  148    40.47    43.67    +3.20    +7.9%
S&P 100       (OEF)     BUY 02/04/15   51    89.49    90.00    +0.51    +0.6%
S&P 400 MidCp (IJH)     BUY 11/05/14  142   140.67   150.42    +9.75    +6.9%
S&P 600 SmlCp (IJR)     BUY 11/03/14  144   110.56   117.07    +6.51    +5.9%
Total Market  (VTI)     BUY 11/03/14  144   103.05   106.87    +3.82    +3.7%
Consumer Disc (XLY)     BUY 11/05/14  142    67.05    74.91    +7.86   +11.7%
Cons Disc EWt (RCD)     BUY 11/03/14  144    82.41    90.81    +8.40   +10.2%
Consumer Stpl (XLP)     BUY 08/20/14  219    44.00    48.71    +4.71   +10.7%
Cons Stpl EWt (RHS)     BUY 10/21/14  157    97.26   107.79   +10.53   +10.8%
Energy        (XLE)    SELL 03/05/15   22    77.65    76.40    +1.25    +1.6%
Energy EWt    (RYE)    SELL 03/06/15   21    65.36    65.08    +0.28    +0.4%
Financial     (XLF)     BUY 02/13/15   42    24.34    23.93    -0.41    -1.7%
Financial EWt (RYF)     BUY 02/05/15   50    44.13    44.21    +0.08    +0.2%
Health Care   (XLV)     BUY 10/23/14  155    63.89    73.04    +9.15   +14.3%
Health Cr EWt (RYH)     BUY 05/09/14  322   115.73   155.80   +40.07   +34.6%
Industrial    (XLI)     BUY 10/30/14  148    54.12    55.55    +1.43    +2.6%
Industrl EWt  (RGI)     BUY 02/09/15   46    88.54    89.11    +0.57    +0.6%
Materials     (XLB) Neutral 03/27/15    0    48.61    48.61 * Changed Today *   -2.5%    50
Materials EWt (RTM)     BUY 02/03/15   52    84.99    85.16    +0.17    +0.2%
Technology    (XLK)     BUY 02/09/15   46    40.87    41.37    +0.50    +1.2%
Technolgy EWt (RYT)     BUY 02/05/15   50    89.42    91.58    +2.16    +2.4%
Utilities     (XLU) Neutral 02/20/15   35    45.33    43.88     ....     ....
Utilities EWt (RYU) Neutral 02/25/15   30    75.94    73.62     ....     ....

Average                               104                               +5.8%
Conclusion: In a strong bull market equal-weighted indexes will most likely perform much better than their cap-weighted counterparts. This superior performance is based upon unleashing the power of the smaller-cap stocks in the index. It is not based on leverage. When using equal-weighted indexes, it is prudent to keep relative strength indexes of them compared to their cap-weighted versions so we are aware of when they are strongest.


