 I noticed today in the DP Reports paid blog that IJR, the S&P 600 ETF, generated a Price Momentum Oscillator (PMO) BUY signal on the DecisionPoint Market/Sector Summary Report. So I followed the rabbit down the hole and decided to check the iShares Russell 2000 ETF, IWM and found that it too had generated a PMO BUY signal. Next stop? The DecisionPoint Trend & Condition ChartPack for the S&P 600 to investigate DecisionPoint indicators that might enlighten us further. I found the McClellan Summation Index most interesting.
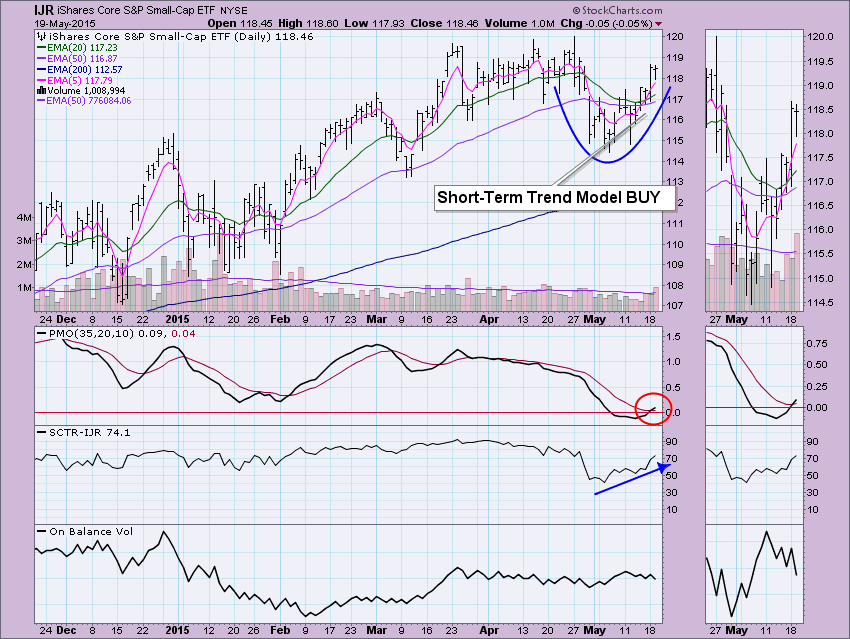
You can see the PMO crossover BUY signal on IJR where the PMO crossed above its 10-EMA in short-term oversold territory. The PMO reading is actually neutral, but looking at the past six months, this is the area the PMO has been bottoming. I annotated a "cup" in blue. It isn't considered a rounded bottom because they are reversal patterns and the current trend is rising, not falling. However, there is a continuation pattern known as a "cup and handle" formation. Generally, after the cup forms, you'll see a "handle" as price consolidates until it builds enough positive pressure to continue the previous trend. Other positive attributes are the recent 5-EMA positive crossover the 20-EMA which generated a Short-Term Trend Model BUY signal. The SCTR value is rising which is also positive.
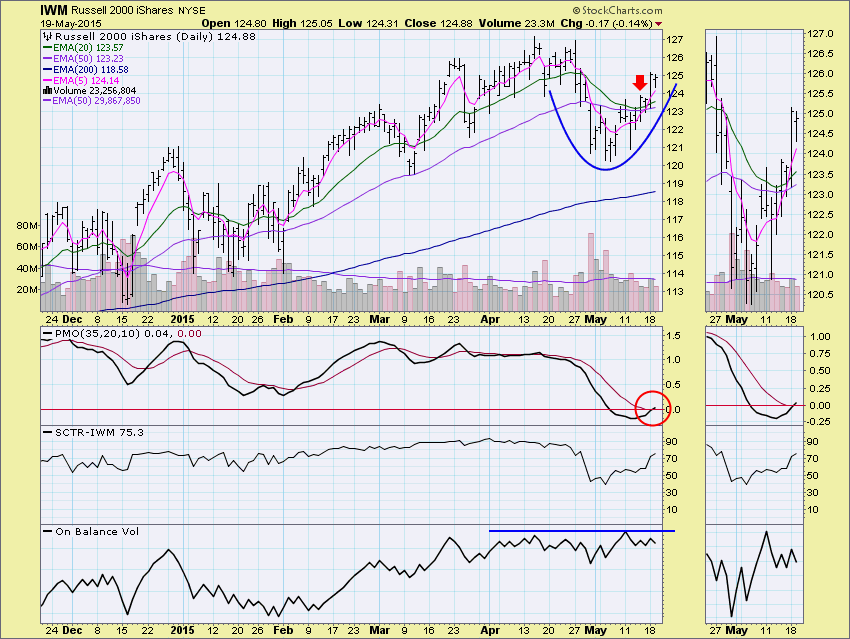
The Russell 2000 ETF (IWM) has understandably a very similar set-up. The Short-Term Trend Model BUY signal occurred just before the confirming PMO crossover BUY signal. On Balance Volume on IWM (like IJR above) is flat implying that volume is not leading price which could be considered a problem but the positives outweigh that negative in my opinion. The SCTR value is also rising and I like the fact that the Intermediate-Term Trend Model was able to avoid a Neutral signal as the 20-EMA turned back up before crossing below the 50-EMA.
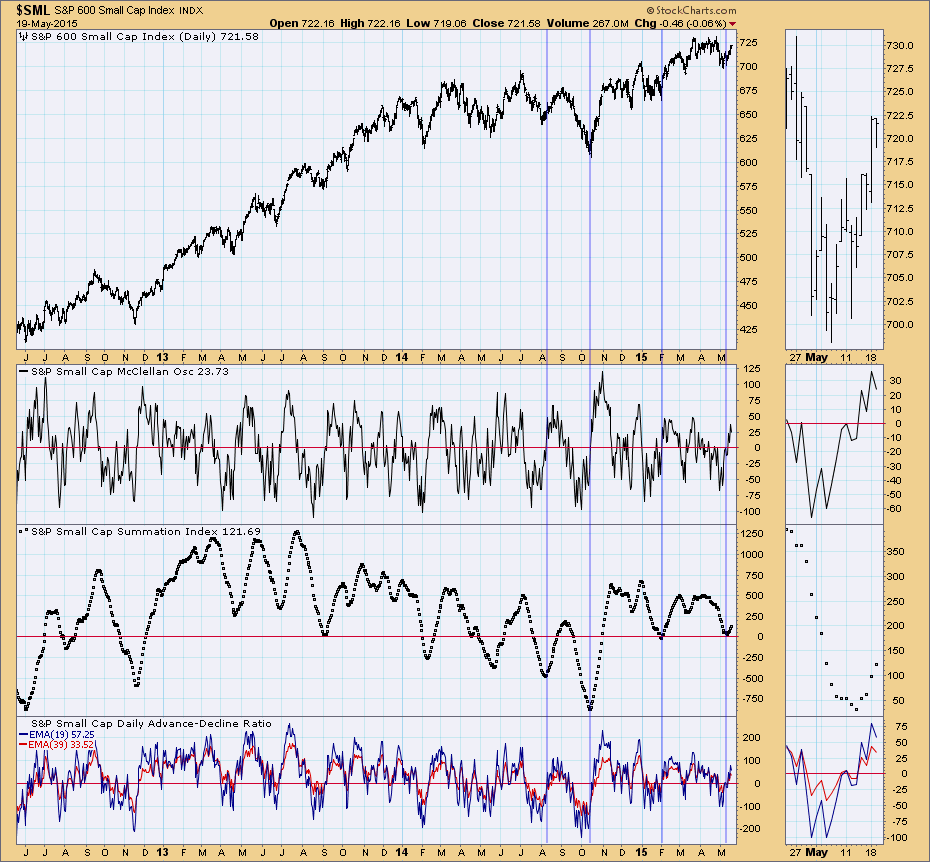
The indicator I found the most interesting from the "DPTC - 1300" ChartList from the DecisionPoint Trend & Condition ChartPack was the McClellan Oscillator chart, specifically the Summation Index. You can see how defined bottoms on this indicator generally correlate to short- to medium-term bottoms. We just saw a nicely defined bottom on the Summation Index.
The medium- and large-cap indexes generated PMO BUY signals before the small caps, however, I like the chart pattern on the small caps right now. They're not pushing against all-time highs (yet) and the continuation pattern that appears to be developing is bullish.
Happy Charting!
Erin
** Technical analysis is a windsock, not a crystal ball **


