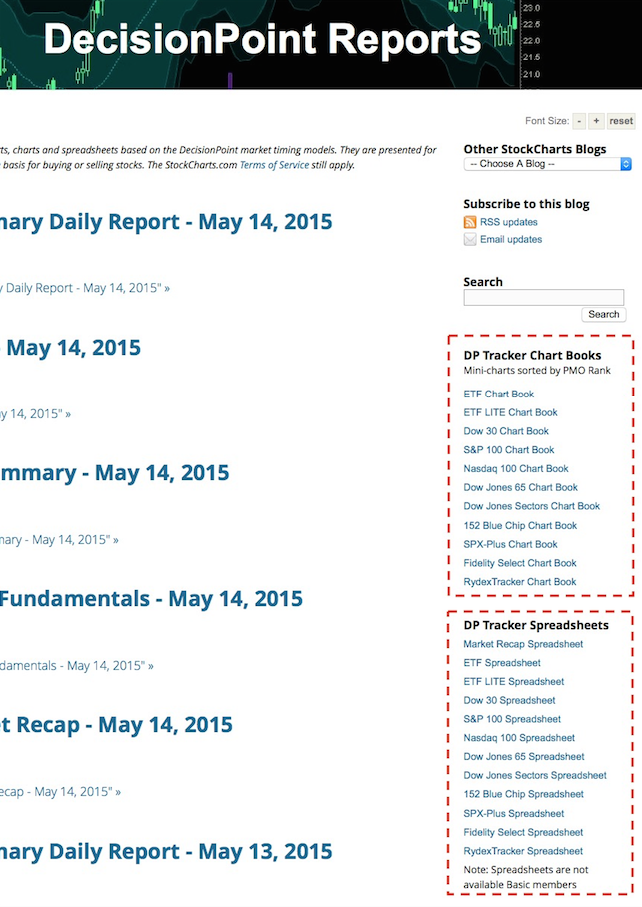
Recently StockCharts.com stopped publishing the DecisionPoint Tracker reports, but links to the Tracker Chart Books and Spreadsheets are still available in the DP Reports Blog. The Tracker Spreadsheets provide the same information as the old reports, but it is in a much more compact format. Additionally, we have added tracking of DP Trend Model signals, which were not part of the old text reports. What are Trackers? They provide extensive, concentrated data to help you 'track' specific lists of stocks, such as the S&P 100, the Nasdaq 100, Dow 65, etc. Below is a picture of the DP Reports Blog, showing the Tracker Chart Book and Spreadsheet links with a red, dashed outline.
Next, as an example, let's look at the Dow 65 Tracker Spreadsheet, which includes the Dow 30 Industrial, the Dow 20 Transport, and the Dow 15 Utility stocks. (The size of this graphic has been reduced to fit in the space. It you are a StockCharts EXTRA or above member, click here to download a current version of the actual spreadsheet. Otherwise, you can drag the image to your desktop to see the full size version.) We can see where the DP Trend Model signals have been inserted--between the PMO Crossover Model and the DP Price Momentum (PMM) Model sections. But wait! What are we to do with all these signals? Each model is constructed differently and generates signals for different time frames and using different methodologies. The PMO Crossover is a short-term indicator, the Trend Model medium-term, and the PMM is longer-term. The correct way to use them is to follow the links to each model's documentation, see how they work, and decide which model you will use and how you will use it. It is important to remember that the signals are information flags, not action commands. The signals tell us that certain technical conditions exist. Look at the chart and decide if any action is appropriate.
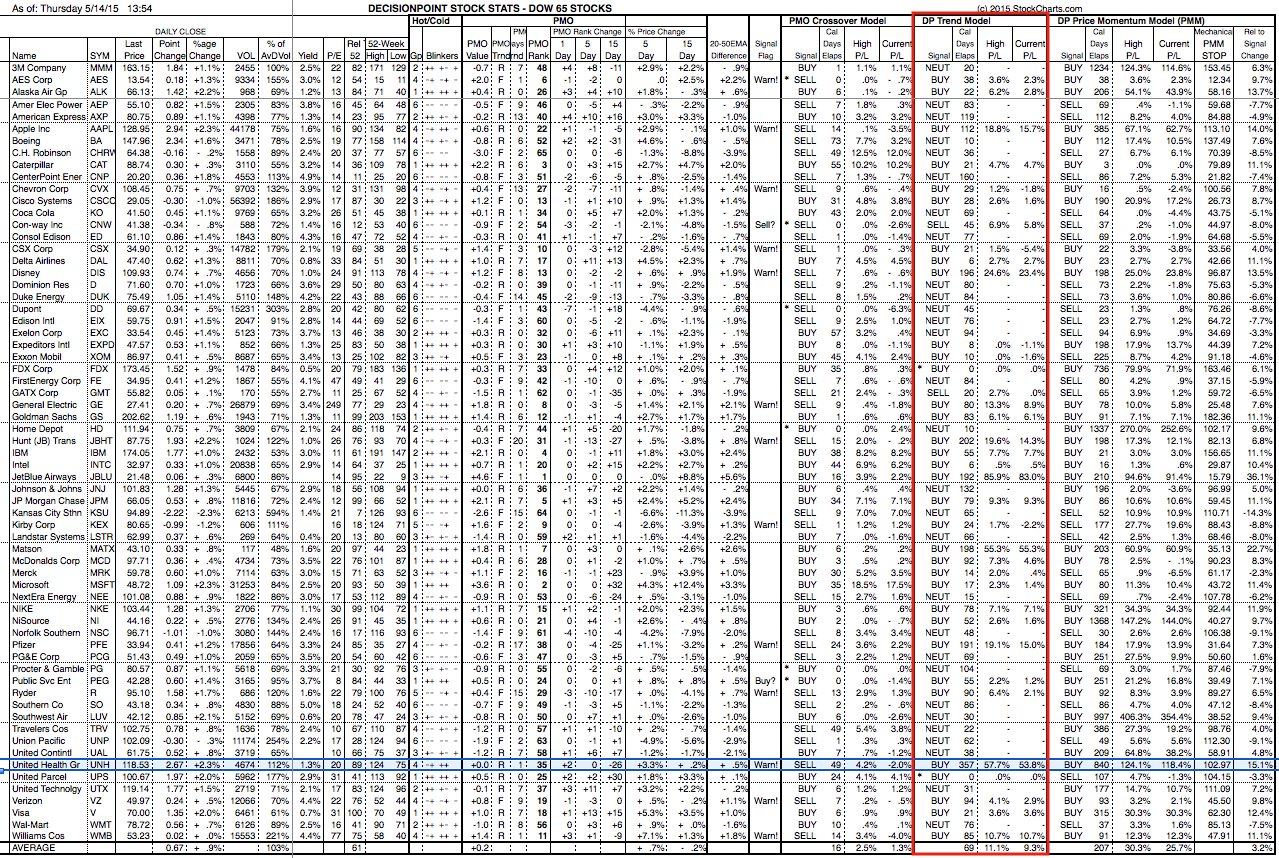
We can also see that each line contains a lot of information on each stock, and the advantage to a spreadsheet is that we can sort the data in any way we choose. Definitions of the column headings can be found on each spreadsheet below the table.
SUMMARY: While the DP Tracker Reports are no longer published, the information they contained is still available on the daily Tracker Spreadsheets, with the addition of DP Trend Model signals. The spreadsheets present an enormous amount of information in one place that can greatly simplify research, once the documentation has been read and understood.


