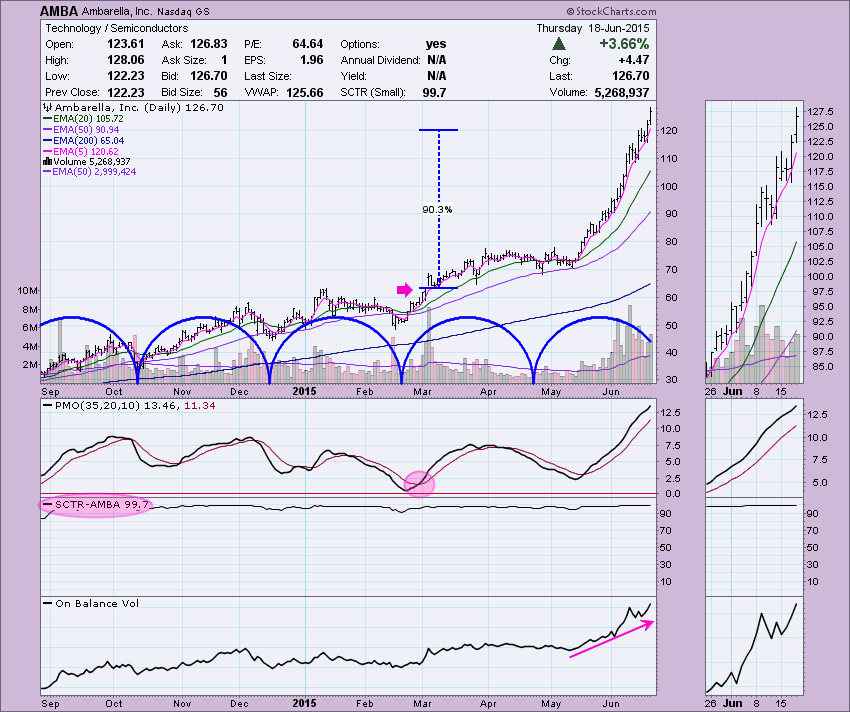
I have received numerous blog comments, emails, etc. asking me to publish the scan that I used to find Ambarella back in February. First, as far as making this stock pick, I told one subscriber that it's nice to get lucky on top of being smart! However, this is not a "big fish" story, you can find some gems with DecisionPoint PMO scans, but you need to know how to read the charts and remember that past performance doesn't guarantee future results. Buying a stock based solely on this scan's results would be suicidal, you MUST read the charts before choosing an investment candidate. In the second part of this blog, I've included a few of the charts that we reviewed during the 6/17 webinar.
Here is the scan I used back in February that returned Ambarella (AMBA) among other investment candidates. I've used comment clauses to help you understand what each formula is trying to return.
// What universe do I want to scan:
[type = stock] AND [Daily SMA(20,Daily Volume) > 50000]
and [country is US]
// Price Momentum Oscillator (PMO) had a positive crossover today
AND[today's PMO Line(35,20,10) > today's PMO Signal(35,20,10)]
AND [yesterday's PMO Line(35,20,10) < yesterday's PMO Signal(35,20,10)]
// PMO has been rising for three days:
AND [today's PMO Line(35,20,10) > yesterday's PMO Line(35,20,10)]
AND [yesterday's PMO Line(35,20,10) > 2 days ago PMO Line(35,20,10)]
AND [2 days ago PMO Line(35,20,10) > 3 days ago PMO Line(35,20,10)]
AND [3 days ago PMO Line(35,20,10) > 4 days ago PMO Line(35,20,10)]
// IT and LT Trend Models are on BUY signals
AND [today's ema(20,close) > today's ema(50,close)]
AND [today's ema(50,close) > today's ema(200,close)]
Here are a few of the charts that we went over in yesterday's (6/17/2015) webinar. You can click here to reach the recording so you'll be able to have some context to the charts below.
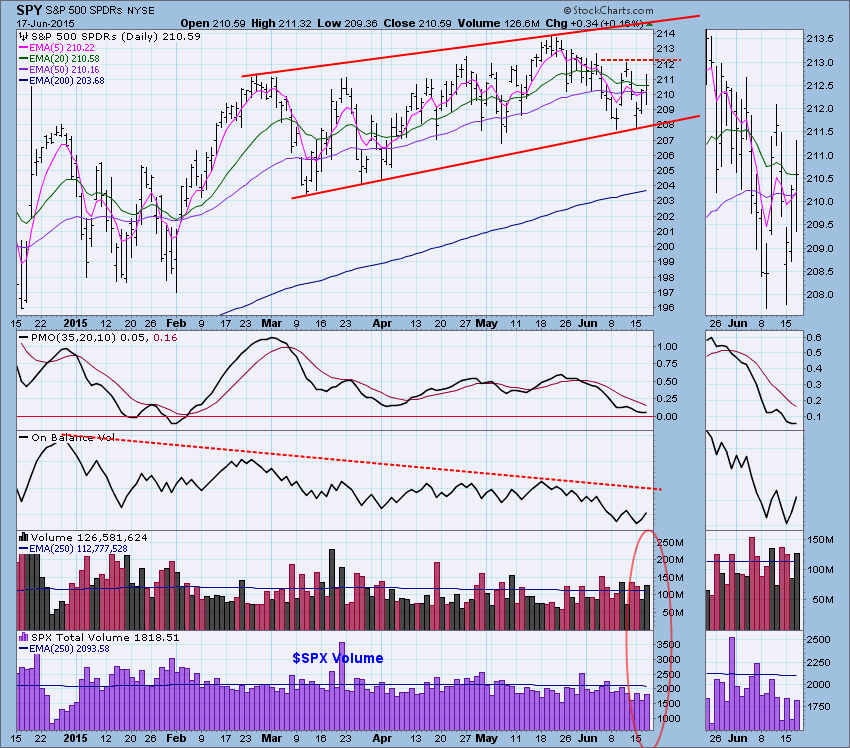
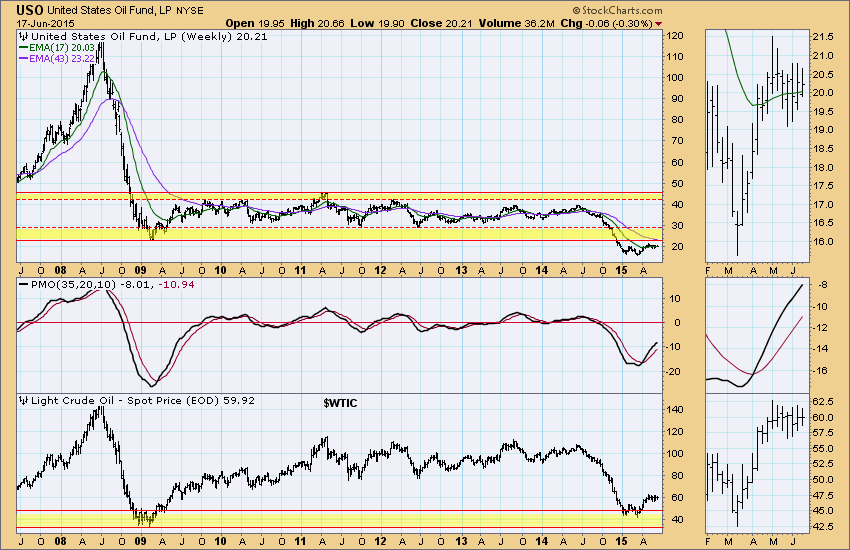
Carl presented these three charts:
He pointed out that there was a short-term double-bottom and to look for a move through the dotted signal line to execute. Which it did!
Carl discussed how the price of oil is still above long-term support which could bode well for USO. Additionally, the weekly PMO is on a BUY signal.
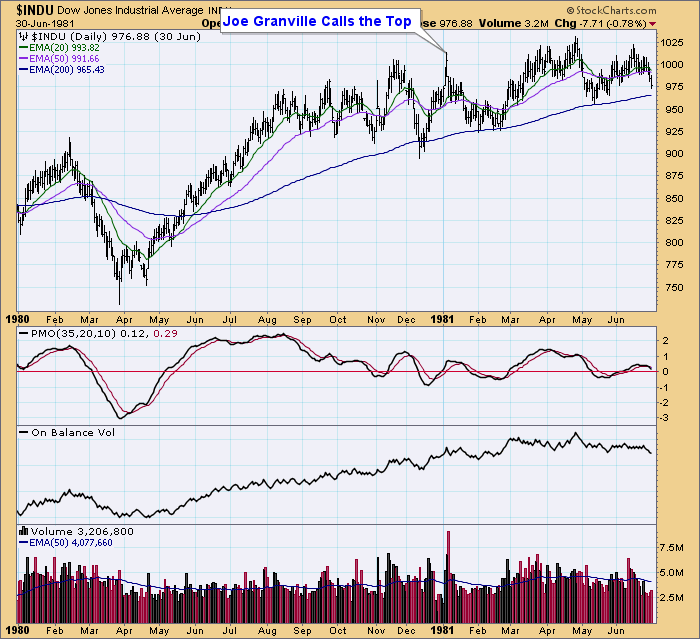
Carl discussed some of the history of "market timing".
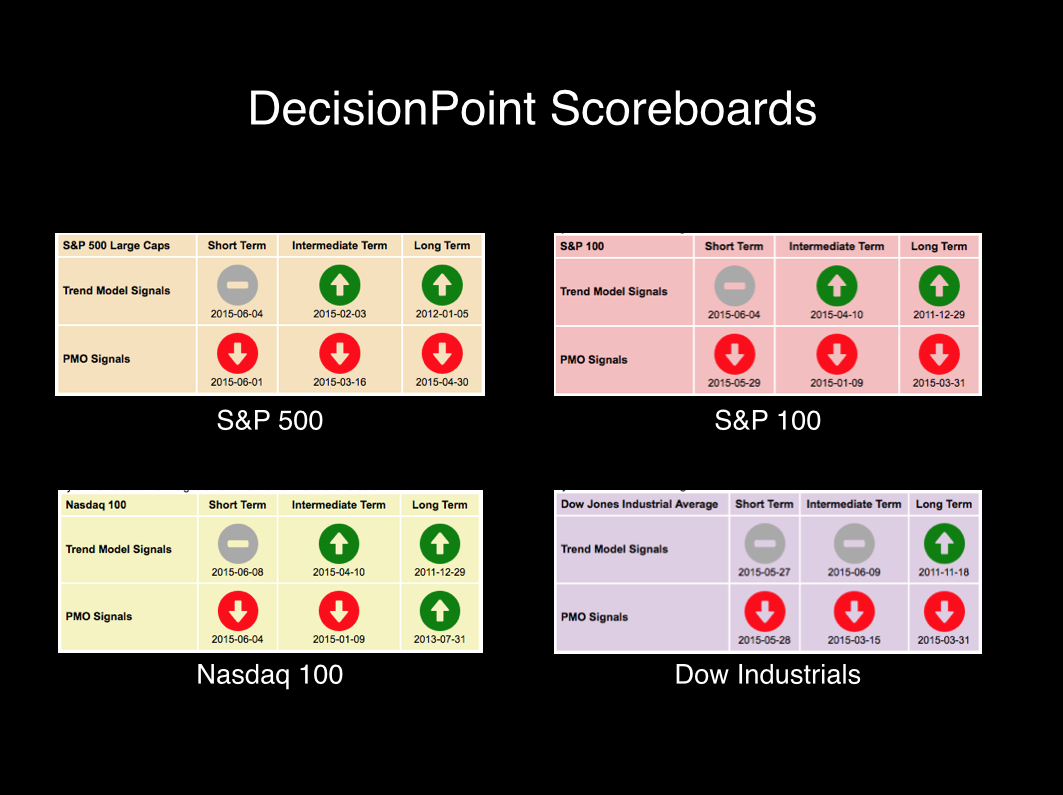
I reviewed the current scoreboards from the DP Chart Gallery:
Don't forget you can find the recording of the 6/17 webinar at this link. Check it out!
Technical Analysis is a windsock, not a crystal ball.
Happy Charting!
- Erin


