We received the following question following our DecisionPoint LIVE webinar:
Currently for the S&P500, all three PMO signals (short-, medium-, and long-term) are in bearish mode. Have there been previous times in the past where the market turned up from here rather than have a sharp correction first? In other words, what is the likelihood that the three bearish PMO signals will occur before a big downturn rather than turning positive without a sharp pullback.
I assume your reference is to the DP Market Scoreboard located on the DP Chart Gallery page for the S&P 500 Index, which shows solid red PMO Signals.
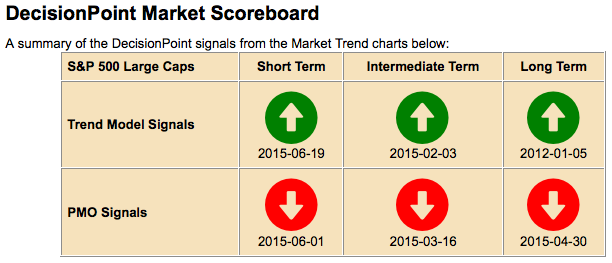
It is a virtual certainty that major declines will be preceded (or accompanied) by PMO SELL signals in all three time frames, but a solid set of PMO SELL signals doesn't always result in a major decline. However, when you see Scoreboard showing solid PMO SELL signals, it is a serious situation, and it is definitely time to take a closer look at the charts.
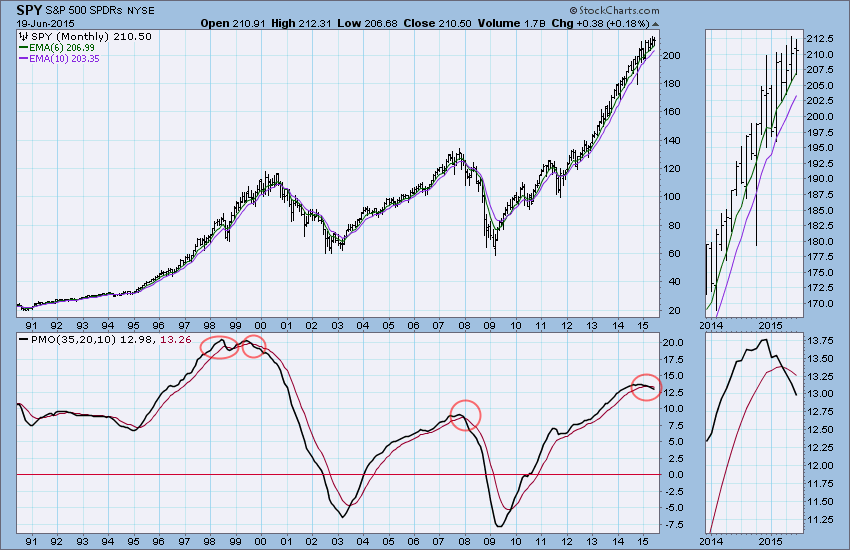
First, we need to remember that the PMO is a condition indicator. It tells us if the market is overbought or oversold, as well as whether internal strength is building or fading. In my opinion, the monthly PMO is the most important. It moves slowly and crosses its trigger line infrequently. On the chart below we can see two successful PMO SELL signals, one in 1999, several months prior to the 2000 market top. The other occurred just as the 2007-2009 bear market was beginning. These examples demonstrate that the occurrence of monthly PMO SELL signals are a strong general warning, but will not necessarily pinpoint the market top. The first signal in 1998 was a fakeout and occurred just as the market was ready to turn up after a sharp correction.
The current monthly PMO SELL signal is unambiguous and has occurred after a six-year bull market advance. I have high confidence that the signal will prove prescient, and that a final bull market top is near.
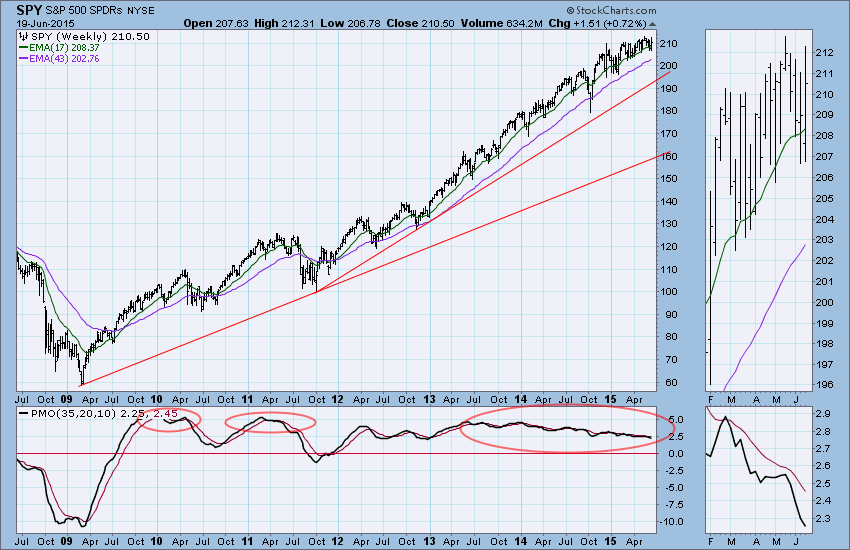
Next, let's look at the weekly PMO for SPY. It has been on a SELL signal since the end of February, but viewed in the broader context of the last year, we can see that the weekly PMO has been moving sideways and gradually lower. PMO signals generated in this context tend to be frequent and of little predictive value. Price has moved higher but at a slower pace, which causes the PMO to move slowly toward the zero line. More useful signals are generated when the PMO changes direction quickly and moves with enough momentum to show some separation between it and the trigger line. The kind of PMO configuration we have currently is negative, but taken alone, not too much to worry about. However, taken with the monthly PMO SELL signal, it carries more weight and should be taken at face value for now.
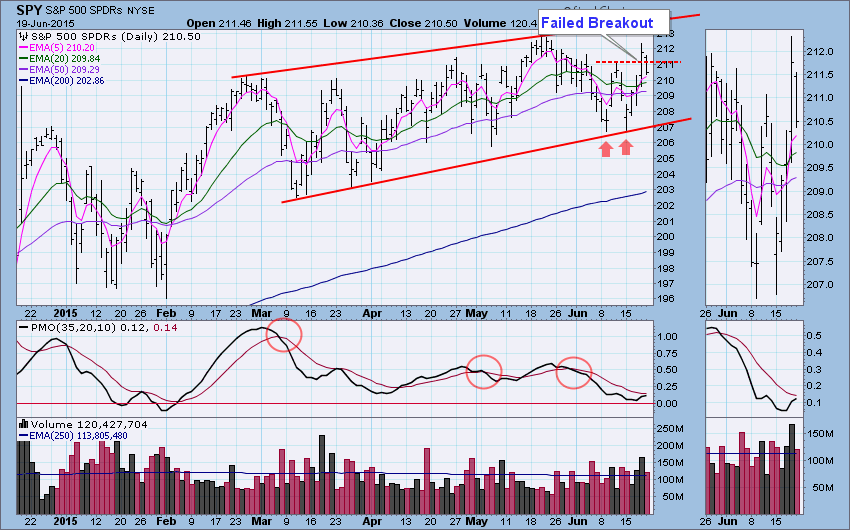
Finally, let's look at the daily PMO, which is, of course, much more active than the weekly and monthly versions. While the current daily PMO SELL signal has overlapped a period of negative price action, the PMO has turned up and is close to generating a PMO BUY signal. However, that may not happen because a double bottom breakout has failed, and continued price decline will cause the PMO to top below the trigger line, a very negative sign in the short term. It is worth noting that the daily PMO crossovers tend to lag price to the extent that it can be better to trade daily PMO direction changes, which provide a lead time that is better than the crossovers.
CONCLUSION: While price action is still bullish--Trend Model signals are BUY in all time frames--PMOs in all time frames tell us that the market is being undermined internally. In particular, the weekly and monthly PMOs are negative and it will require persistently positive price action to reverse the outlook in those time frames. Bottom line, in my opinion, the market is probably in a topping process that will result in a significant decline.
REMEMBER: indicators, like the PMO are not finalized until after the close at the end of the period they cover. For example, the monthly PMO reading for June will not be "official" until the end of the month, after the close on June 30, 2015
Technical analysis is a windsock, not a crystal ball.
Happy Charting!
Carl


