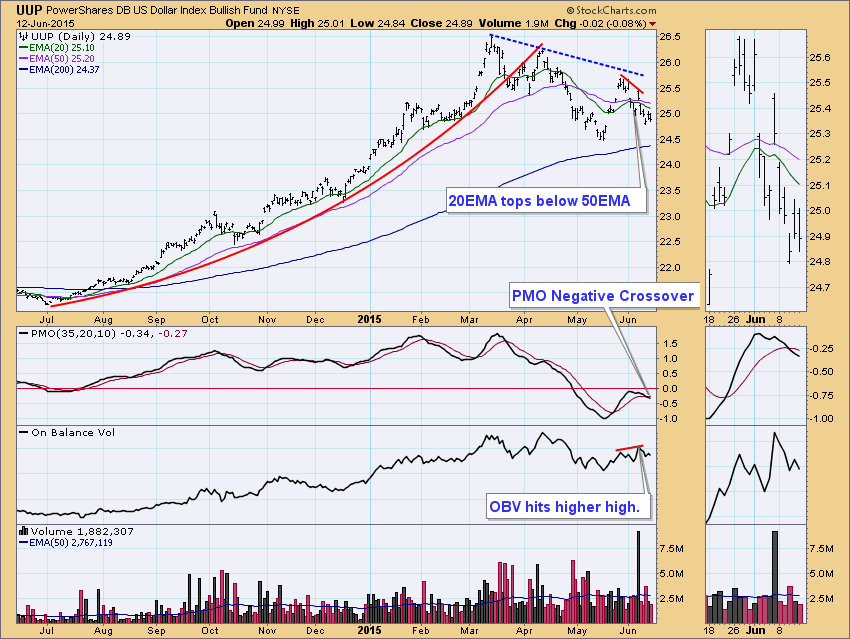
The outlook for gold depends primarily on the outlook for the U.S. dollar, so let's look at the chart of the dollar ETF. After declining for about two months from the March top, UUP rallied in May, but topped before it could reach the declining tops line. There has also been a short-term OBV reverse divergence, which is when OBV makes a higher top corresponding to a lower price top. This is a small volume blowoff, indicating that higher volume couldn't move price higher. Also, the 20EMA topped below the 50EMA, and the PMO crossed down through its trigger line. All this negative evidence points toward a continuing decline of the dollar.
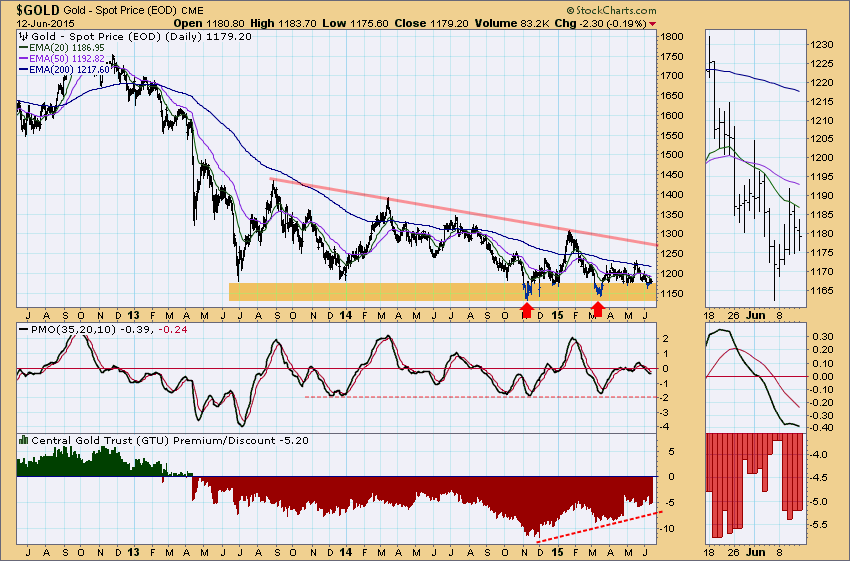
As for $GOLD, it failed to exploit a nice looking double bottom, and it recently bottomed in a zone of support. The triangle formed by the declining tops line and the support zone is bearish because the bottom line is flat and is the most likely side of the triangle to fail. At the end of May the 20EMA crossed down through the 50EMA, generating a Trend Model SELL signal because the 50EMA was below the 200EMA. On the positive side, the discount for Central Gold Trust has been steadily contracting since its low last year, which shows that sentiment for gold is improving. To clarify, Central Gold Trust (GTU) is a closed-end mutual fund that owns actual gold. Being closed-end, it trades like a stock, which means its price is based upon the bid and ask, not its net asset value (NAV). Because of this, GTU can trade at a premium or discount to net asset value, thereby indicating how anxious investors are to own or to be rid of the stock.
Conclusion: The performance of gold is rather uninspiring as it continues a nearly two-year sideways dribble. In fact, I would have to say that, based solely upon the price movement of $GOLD, the outlook leans toward the negative. However, the expected continued weakness in the dollar, and improvement in the sentiment for gold, give us an indication that gold may finally begin to move higher in the longer term. Nevertheless, I still feel like it is about a 50-50 call at this point.
Technical analysis is a windsock, not a crystal ball.
Happy Charting!
Carl


