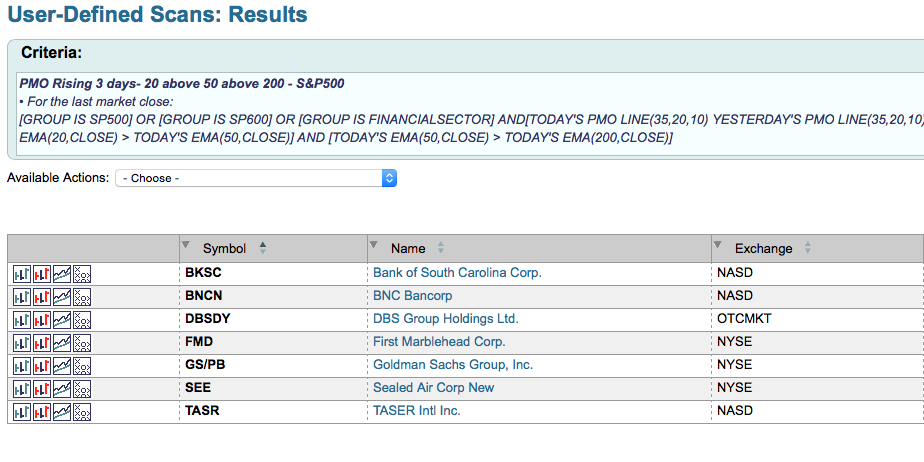
 Yesterday during the DecisionPoint LIVE! webinar (link here), I demonstrated how to 'pick' stocks the DecisionPoint way using the Scanning Workbench available to Extra, ExtraRT and Pro members. I've created quite a few different scans that take advantage of the DecisionPoint Price Momentum Oscillator (PMO) and Trend Models. I actually use this scan, among others, to find investment prospects for myself. The key to remember is to ALWAYS look at the chart before making any investment decision, scanning and mechanical signals alert you so that you can narrow the candidates for review. The "magical" scan is below. I've annotated within it so that you can make your own adjustments (Anything beginning with "//" will not scan).
// The "universe" you are scanning:
[group is SP500]
OR [group is SP600]
OR [group is FinancialSector]
// PMO has not yet had a crossover:
AND[today's PMO Line(35,20,10)<today's PMO Signal(35,20,10)]
// PMO Rising for last three days:
AND [today's PMO Line(35,20,10) > yesterday's PMO Line(35,20,10)]
AND [yesterday's PMO Line(35,20,10) > 2 days ago PMO Line(35,20,10)]
AND [2 days ago PMO Line(35,20,10) > 3 days ago PMO Line(35,20,10)]
// Positive Line-up of EMAs 20-EMA > 50-EMA > 200-EMA (Implies Stock is in an IT or LT Bull market:
AND [today's ema(20,close) > today's ema(50,close)]
AND [today's ema(50,close) > today's ema(200,close)]
Running the scan right now, here are the results received.
Next, I take these results and using the drop down create a ChartList with just these results. Once my ChartList is ready for review, I use CandleGlance to view the results so I can get a quick look and discard any that don't look promising. Be aware, your CandleGlance page will likely look different unless you saved a similar CandleGlance ChartStyle. Here's an article I wrote on how to set up your own CandleGlance and ChartStyles.
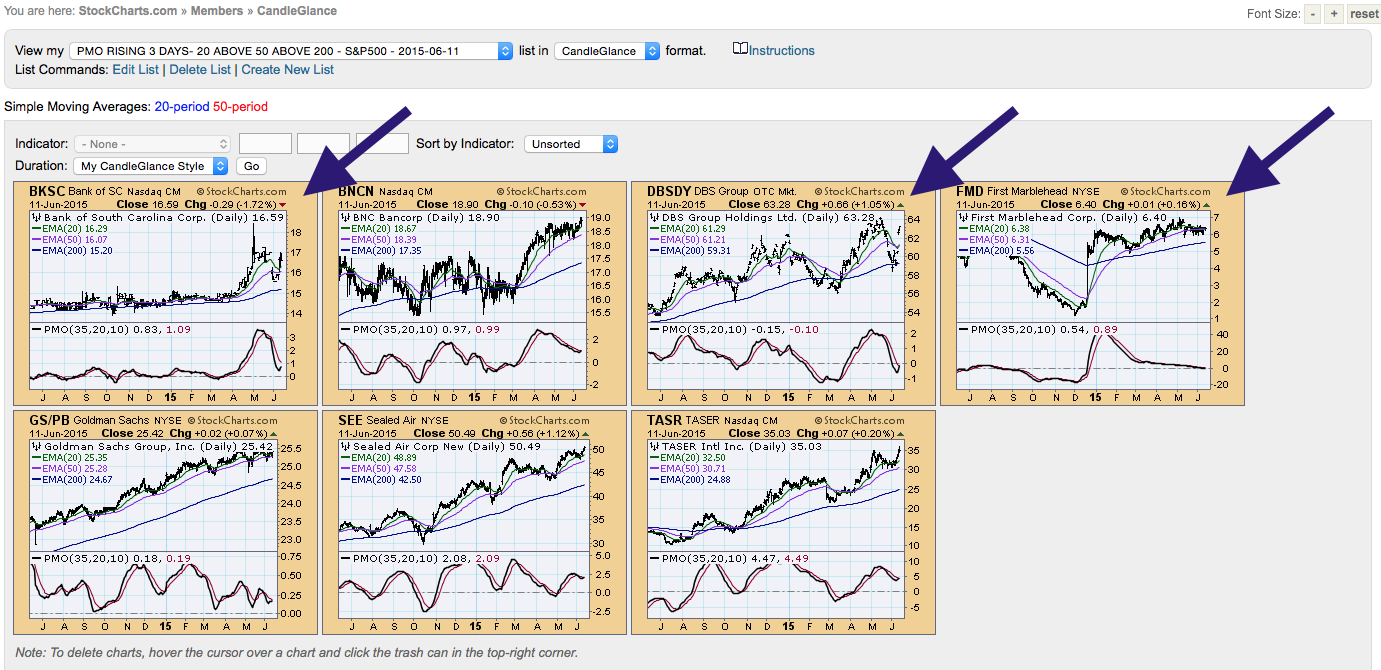
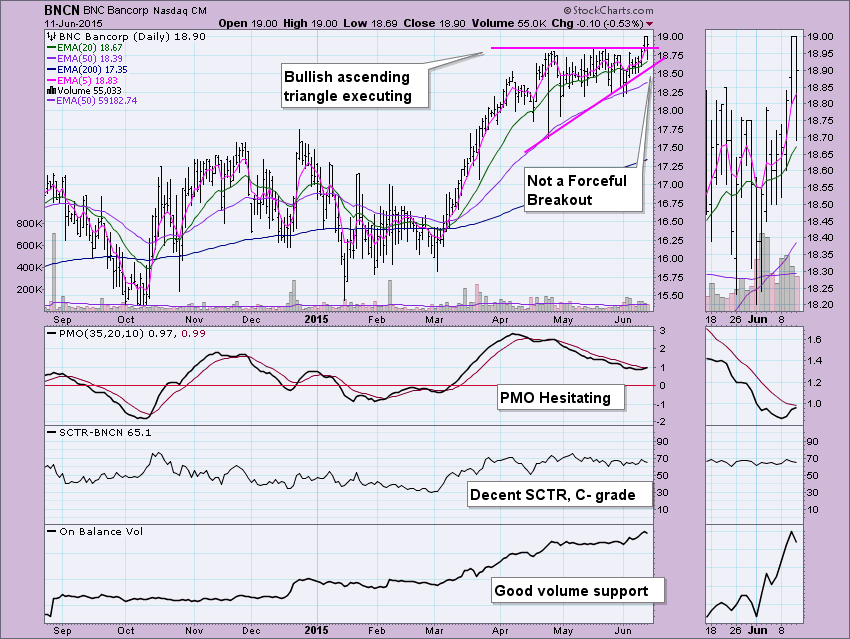
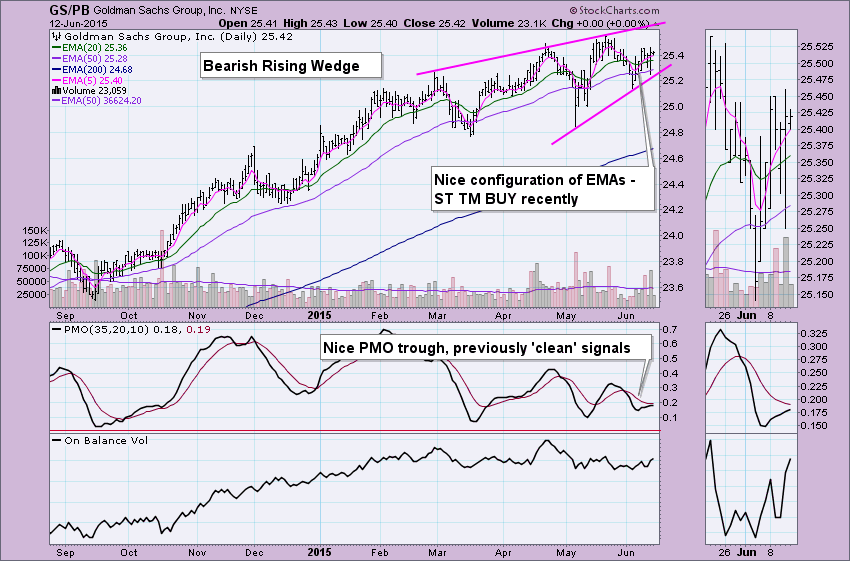
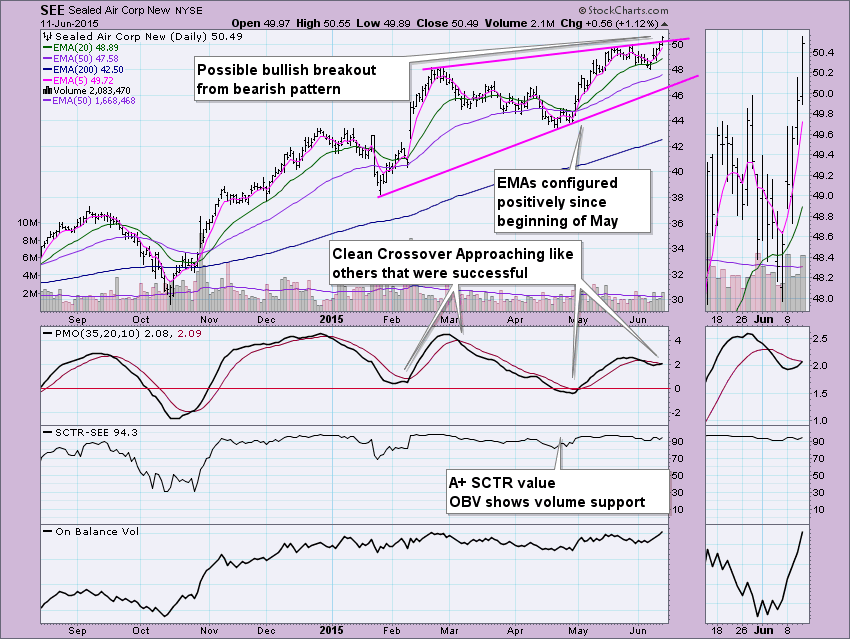
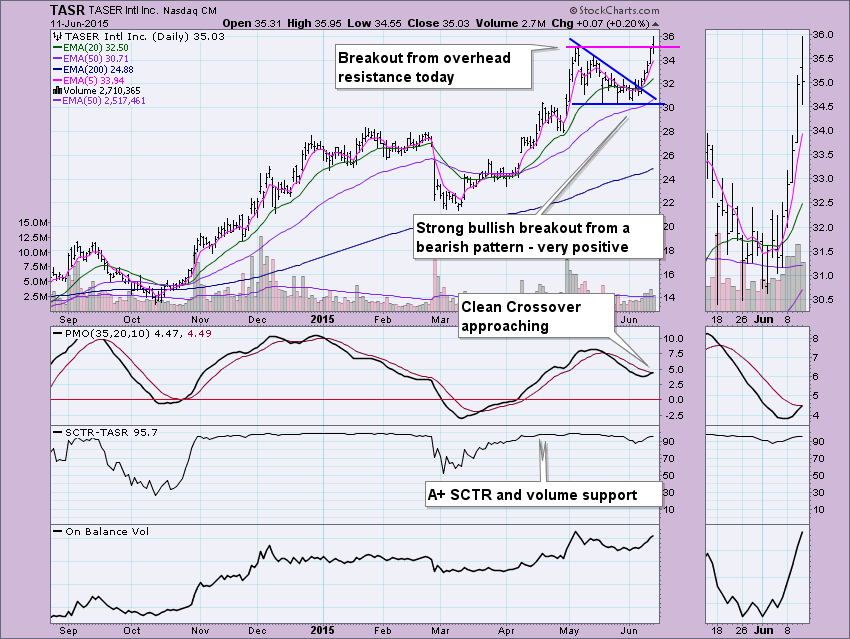
I immediately see three candidates that I'm going to discard. If you hover your cursor over the upper right-hand corner of the chart, a little trash can will appear and you can discard them directly from the CandleGlance page. The first two of these stocks are too thinly traded for my taste. The last one has a PMO that is way too flat and has been in a continuation pattern forever. That leaves four candidates to review. If you do find something of interest from a scan, I recommend that once you narrow it down, be sure to view the stock in various timeframes to get a solid picture of what the trends and momentum are like. The charts are below with my annotations. (This is NOT a recommendation to buy these stocks, this is for educational purposes only.)
Conclusion: Technical scans are invaluable to investors. I've done quite well using them, but it does take an eye for it and the ability NOT to "force" it. If there isn't a great or close to 'perfect' opportunity today, the scan will likely come up with something just as good or better the next day or the day after. Also, a caveat, this scan can be used in reverse for finding shorting opportunities. My preference is to scan in conjunction with the major market trend, not against it, which is akin to swimming upstream, so currently I'm using the scan above or variations thereof.
Technical Analysis is a windsock, not a crystal ball.
Happy Charting!
- Erin


