A subscriber recently wrote to me questioning why I had written and changed the signal on the $SPX Scoreboard to neutral yesterday, but it wasn't on the most recent DecisionPoint Market/Sector Summary. This is because DecisionPoint timing signals that are tracked by the professional publication, Timer Digest, are derived from the ETF versions of the indexes. Today we got a great example of a similar situation. $DJIA had an Intermediate-Term Trend Model Neutral signal generate today when the 20-EMA crossed below the 50-EMA while the 50-EMA was above the 200-EMA. The DecisionPoint Scoreboard in the DP Chart Gallery was updated to reflect this today. However, DIA, the ETF version of the Dow Industrials that is tracked in our DP Market/Sector Summary report, hasn't generated the signal.
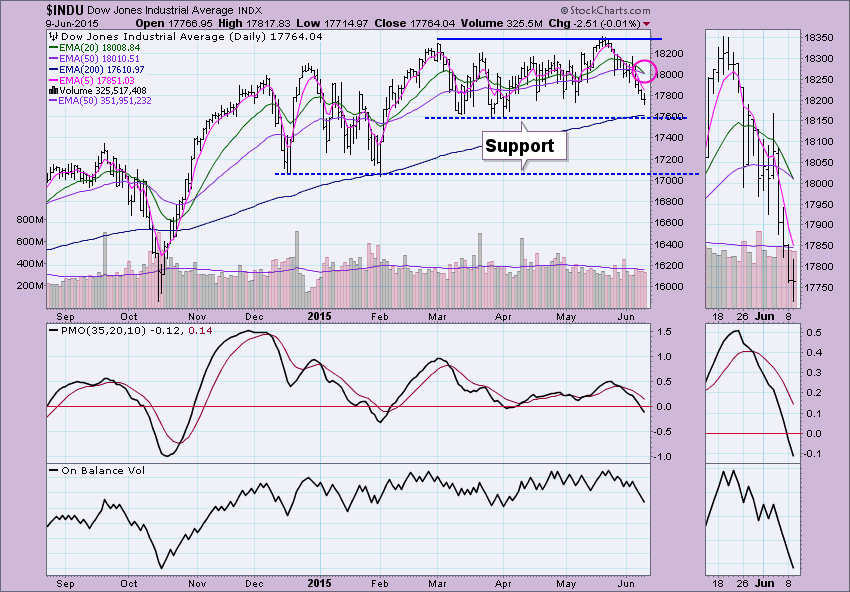
If you look at the $DJIA chart you can see the 20/50-EMA crossover that caused the signal change. The Dow has been trading within a horizontal trading range bounded by the all-time highs and the March lows. Price has nearly reached the bottom of the range and the first area of possible support. The Price Momentum Oscillator (PMO) readings have now moved below zero which is the first sign of trouble. The earlier PMO SELL signal was not good and notice OBV is dropping off to readings that we haven't seen since March.
Now the ETF version, DIA, has a different "feel" altogether. I can still distinguish the horizontal trading range, but note that the May highs broke out above resistance. The biggest difference is that the 20-EMA is still managing to stay above the 50-EMA. That looks like it will change soon. The PMO reading hasn't moved below zero since January; whereas, $DJIA PMO moved below zero back in April.
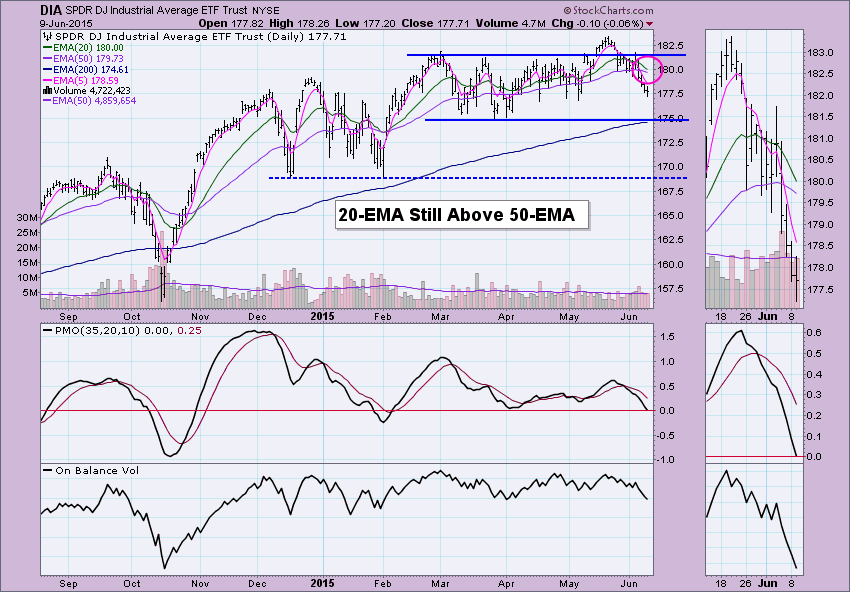
In both cases, the PMO suggests that price will test nearby support at the March lows given that momentum is so negative. The IT Trend Model Neutral signal is also a bad sign for both $DJIA and DIA. I believe it most likely that we will see a test closer to the secondary support line at the December/January lows.
I agree with Carl that the ETFs are preferable, because: (1) they are tradable, (2) they represent the total return on the index, (3) they are adjusted for dividends, and (4) they often give different signals than the $ index which can be more profitable.
Technical Analysis is a windsock, not a crystal ball.
Happy Charting!
- Erin


