The SPY in the last three days has been trending higher, so expectation would be that short-term indicators would reflect that strength. They are currently deteriorating or pointing to internal weakness. In today's DecisionPoint Alert blog, I reviewed the short-term charts below (as well as intermediate-term charts not included). You can find the article here.
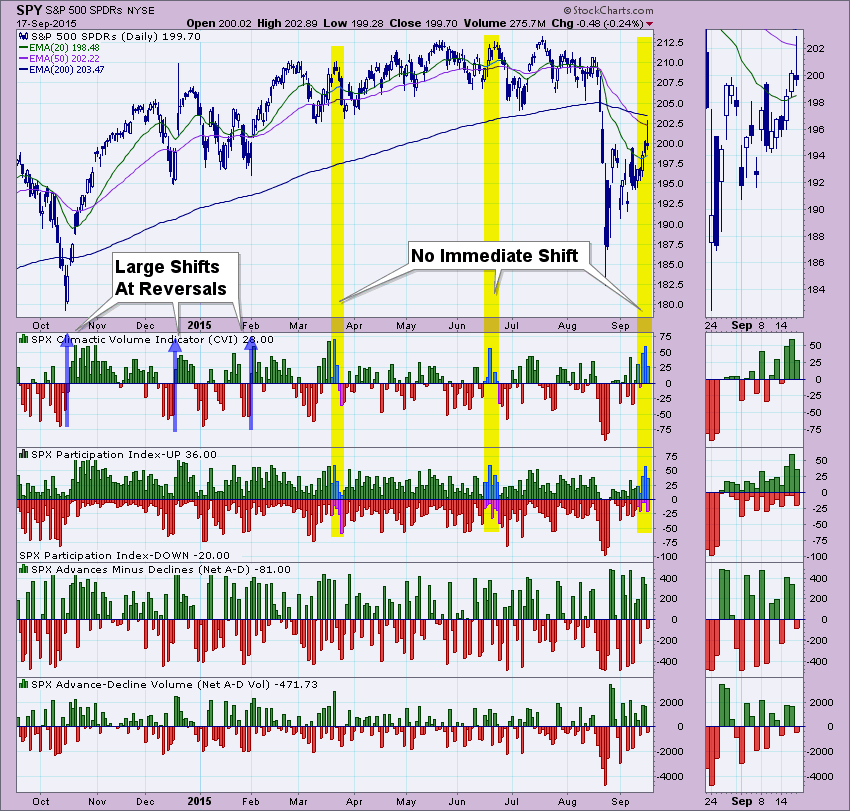
On our ultra or very short-term indicators we look for climactic moves not just readings. Yesterday we had climactic readings on both the Climactic Volume Indicator (CVI) and Participation Index - UP. I like to judge these climaxes as either an initiation impulse or exhaustion. As you can see from the October low and the two major lows after that, we had very climactic positive readings that turned out to be initiation impulses. In the case of the annotated yellow previous tops, these climactic positive readings were followed by a decline. The difference I observe is the immediate shift from very negative climactic readings to very positive climactic readings. That shift didn't occur on those last previous tops and it didn't happen this time. Note that our previously climactic negative readings happened in August; it took until September 16 for the follow-on positive climactic readings.
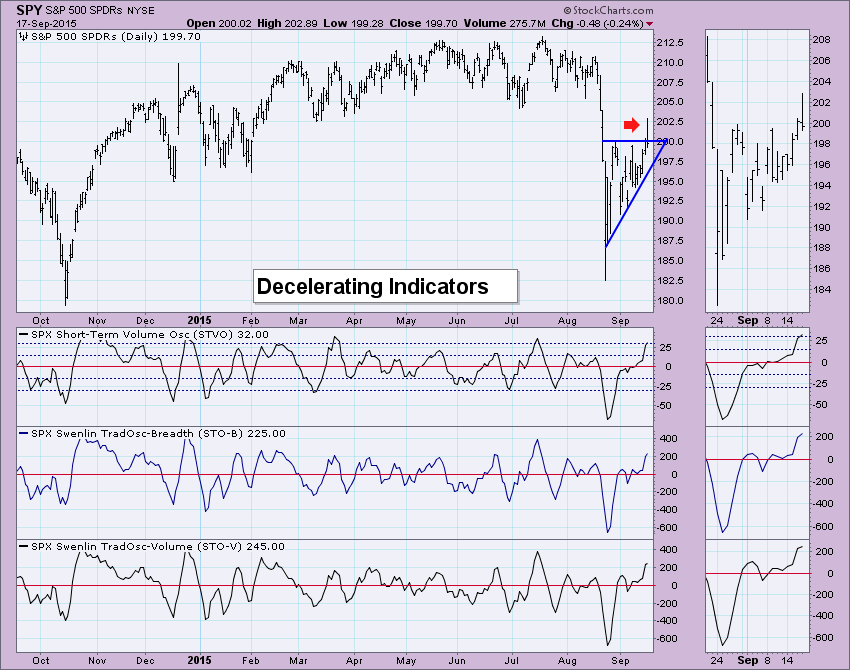
With today's intraday breakout, we might expect to see these indicators continuing up at an accelerated speed. The opposite was true today, likely due to negative close. All three of these indicators began to decelerate to possibly curl downward. Additionally, all of the indicators are in mostly overbought territory meaning downward pressure on the oscillator will be increasing.
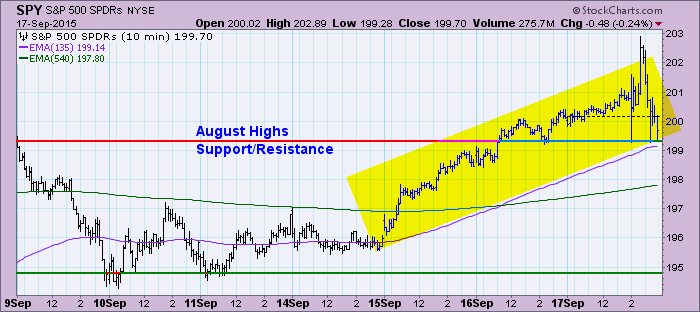
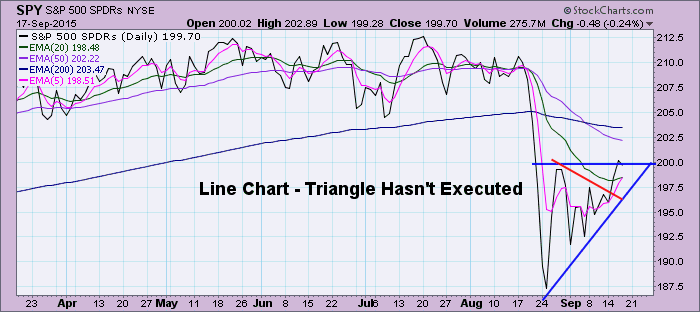
One final thought, when looking at the SPY price movement in the chart above, the breakout is impressive. This is a bullish ascending triangle so the expectation is a breakout, nothing else. The concern should be, "Is that it?" This breakout could technically be considered "the" breakout, despite a negative close. The possibility of a bullish continuation exists. When you look at the SPY chart using only closing prices, the triangle still hasn't executed. A possible negative is that "it still hasn't executed" and won't if it couldn't hold the intraday high or hold on to a positive close.
Technical Analysis is a windsock, not a crystal ball.
Happy Charting!
- Erin


