We track the percentage of stocks above their 20EMA, 50EMA, and 200EMA because this helps us determine market condition in the short, medium, and long time frames. While this indicator is available for numerous market and sector indexes, we usually concentrate on the stocks S&P 500 Index for a view of the broad market.
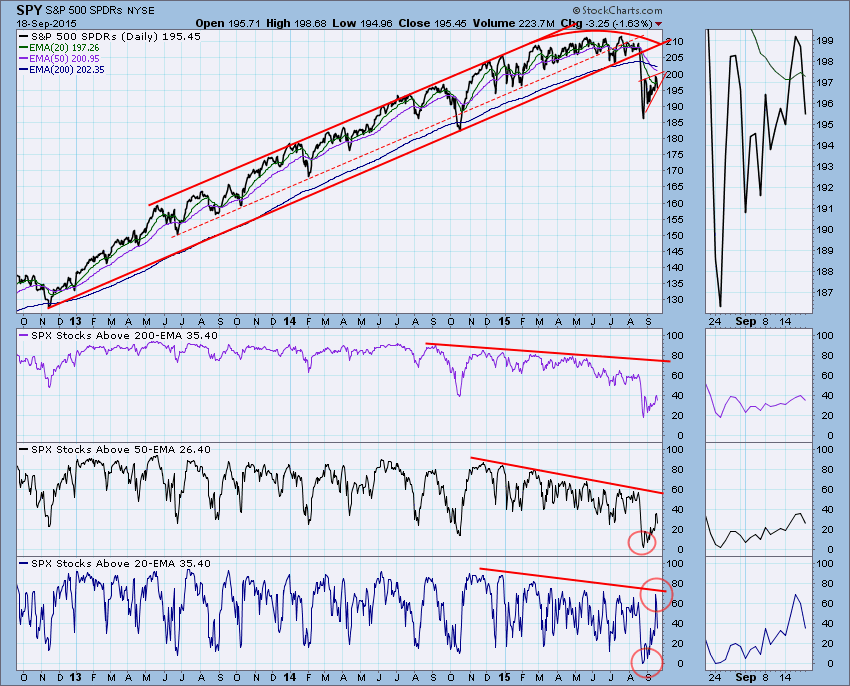
We can see that in August the 20EMA and 50EMA indicators got extremely oversold, while the 200EMA indicator reached its lowest point in three years. Typically, the shorter-term indicators do not linger at such low levels, and a rebound was likely. Since the rally off the lows, the 20EMA indicator reached relatively overbought levels when compared to the last nine months or so, and we can see in the thumbnail chart that the SPY itself briefly popped above its 20EMA. Should we expect that the 50EMA and 200EMA indicators will move to overbought levels before downward pressure returns? No, I don't think so. We are in a bear market and they have probably moved up as far as they are going to for this bounce.
You will note on the price chart that price has screwed itself into a rising wedge formation, and on Friday it broke down from that wedge. It is not a decisive break yet, but the bear market context leads me to believe that the break will be extended next week, and that the market is beginning another down leg to test the August low. Again, since we are in a bear market, that test will probably fail.
Technical analysis is a windsock, not a crystal ball.


