 Every day, we publish a complete Market/Sector Summary in the DP Reports Blog. Not many are aware of its usefulness or even its existence! I publish an excerpt from that report every day in the DecisionPoint Alert day's analysis blog. Something very interesting has been happening on this report over the past couple of months. It has "flipped". This report contains our Intermediate-Term Trend Model (ITTM) signals. Whenever the 20-EMA crosses above the 50-EMA, the ITTM goes on a BUY signal. If the 20-EMA crosses below the 50-EMA, the signals are Neutral or SELL. If the 50-EMA is above the 200-EMA, it is a neutral signal; conversely if the 50-EMA is below the 200-EMA, it is a SELL signal.
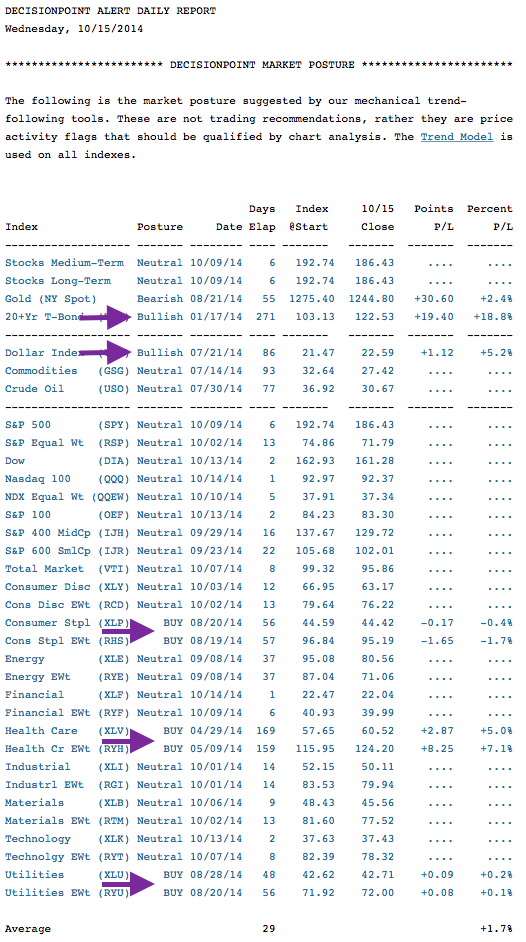
Here is today's table from the DP Market/Sector Summary. The links are "hot", so if you click on a line in this table, it will bring up the chart on the charting workbench. Notice that EVERY sector or index on this report is on a Neutral or SELL signal with the exception of TLT.
DECISIONPOINT MARKET/SECTOR SUMMARY DAILY REPORT
Thursday, 9/3/2015

************************ DECISIONPOINT MARKET POSTURE ***********************

The following is the market posture suggested by our mechanical trend-
following tools. These are not trading recommendations, rather they are price
activity flags that should be qualified by chart analysis. The Trend Model is
used on all indexes.


                                     Days   Index     09/03   Points  Percent
Index               Posture     Date Elap  @Start     Close      P/L      P/L
------------------- ------- -------- ---- -------   -------  -------  -------
Stocks Medium-Term  Neutral 08/20/15   14   204.01   195.65     ....     ....
Stocks Long-Term    Neutral 08/20/15   14   204.01   195.65     ....     ....
Gold (NY Spot)      Bearish 05/29/15   97  1189.80  1124.50   +65.30    +5.5%
20+Yr T-Bond  (TLT) Bullish 07/31/15   34   122.00   121.51    -0.49    -0.4%
------------------- ------- -------- ---- -------   -------  -------  -------
Dollar Index  (UUP) Neutral 08/21/15   13    24.80    25.16     ....     ....
Commodities   (GSG) Bearish 06/22/15   73    20.79    17.70    +3.09   +14.9%
Crude Oil     (USO) Bearish 07/06/15   59    17.73    15.34    +2.39   +13.5%
------------------- ------- -------- ---- -------   -------  -------  -------
S&P 500       (SPY) Neutral 08/20/15   14   204.01   195.65     ....     ....
S&P Equal Wt  (RSP) Neutral 06/29/15   66    79.60    75.50     ....     ....
Dow           (DIA) Neutral 07/23/15   42   176.59   163.67     ....     ....
Nasdaq 100    (QQQ) Neutral 08/21/15   13   102.59   103.39     ....     ....
NDX Equal Wt (QQEW) Neutral 08/11/15   23    44.15    41.43     ....     ....
S&P 100       (OEF) Neutral 08/20/15   14    89.95    86.26     ....     ....
S&P 400 MidCp (IJH) Neutral 07/07/15   58   150.45   140.34     ....     ....
S&P 600 SmlCp (IJR) Neutral 07/24/15   41   115.08   109.50     ....     ....
Total Market  (VTI) Neutral 08/06/15   28   107.71   101.20     ....     ....
Consumer Disc (XLY) Neutral 08/24/15   10    71.39    74.65     ....     ....
Cons Disc EWt (RCD) Neutral 08/12/15   22    90.05    86.70     ....     ....
Consumer Stpl (XLP) Neutral 08/25/15    9    45.70    47.29     ....     ....
Cons Stpl EWt (RHS) Neutral 08/25/15    9   102.61   106.59     ....     ....
Energy        (XLE)    SELL 06/01/15   94    77.67    64.88   +12.79   +16.5%
Energy EWt    (RYE)    SELL 06/04/15   91    66.39    54.46   +11.93   +18.0%
Financial     (XLF) Neutral 08/24/15   10    22.65    23.08     ....     ....
Financial EWt (RYF) Neutral 08/24/15   10    41.00    41.59     ....     ....
Health Care   (XLV) Neutral 08/21/15   13    71.71    69.55     ....     ....
Health Cr EWt (RYH) Neutral 08/24/15   10   147.61   149.92     ....     ....
Industrial    (XLI) Neutral 06/05/15   90    55.58    51.07     ....     ....
Industrl EWt  (RGI) Neutral 06/08/15   87    88.47    82.01     ....     ....
Materials     (XLB) Neutral 06/25/15   70    49.58    42.90     ....     ....
Materials EWt (RTM) Neutral 06/29/15   66    85.85    77.88     ....     ....
Technology    (XLK) Neutral 08/19/15   15    42.16    39.91     ....     ....
Technolgy EWt (RYT) Neutral 06/30/15   65    90.24    86.07     ....     ....
Utilities     (XLU) Neutral 09/02/15    1    41.34    41.53     ....     ....
Utilities EWt (RYU)    SELL 09/01/15    2    68.66    69.40    -0.74    -1.1%

Average                                36                              +11.1%
Let's look at this same table on October 15, 2014, the bottom of the October "crash". I see quite a few sectors that didn't turn over. TLT was also still bullish at the October bottom, but it was joined by the Dollar, Consumer Staples and Health Care. Those last sectors are considered 'defensive'. So, the big problem with the chart above is there really is no place to hide out should the market continue lower.
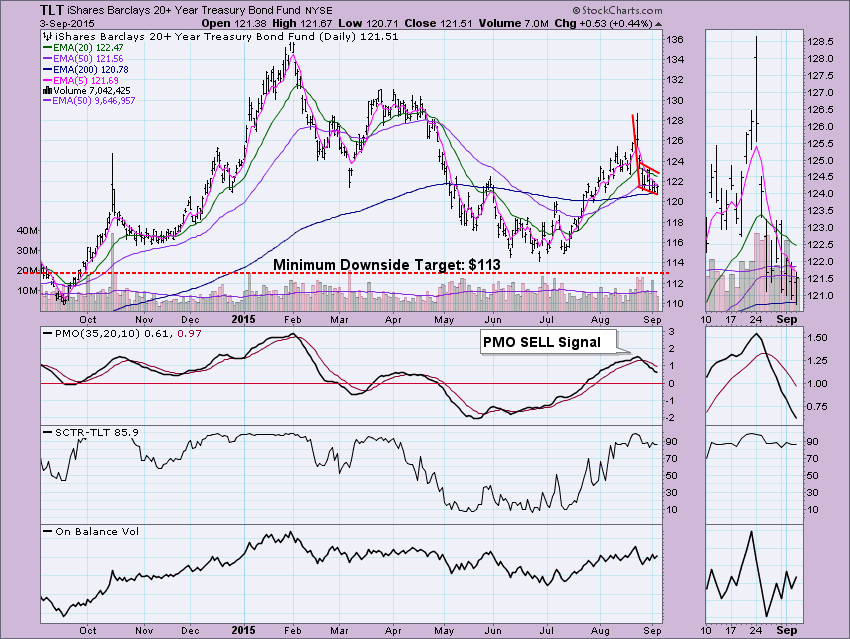
What about TLT? It's still bullish. However, I don't like TLT as a place to weather a storm. There are a few positive characteristics to this chart, but mostly it appears bearish. First positive: The SCTR value hasn't suffered (although it could be due to it not doing as badly as its counterparts). The second positive: our current posture is bullish based on the configuration of the 20/50/200-EMAs. Unfortunately, the negatives outweigh these positives in my opinion. The Price Momentum Oscillator (PMO) is falling (negative momentum) after a SELL signal. A Short-Term Trend Model (STTM) Neutral signal appeared a while ago with the negative 5/20-EMA crossover. Finally, the bearish reverse flag is calling for a decline all the way down to $113.
Conclusion: The DP Market/Sector Summary found in the DP Reports blog is an excellent place to visually see the relative strength and weakness of all of these popular indexes and sectors. Not only can you use the ITTM posture table at the top of the report, you can review the rest of the report and see how each sector is performing as far as the PMO values. Remember, the PMO is normalized and its values can be compared to others to gather relative strength data based on the PMO. While doing my research for this article, I noted that of all the sectors/indexes listed in the report, only three have 20-EMAs that are rising and could help flip a few signals back to bullish. I'll reveal them and analyze the charts in "The DecisionPoint Report with Erin Heim - Weekly Edition" webinar as well as in a ChartWatchers article this weekend! Sign up for this new DP webinar that will give you a 30-minute review of what the markets and the big four (UUP, Gold, USO & TLT) have been up to this week. The link to sign up for all of the StockCharts.com webinars is in the "What's New" section of the homepage.


