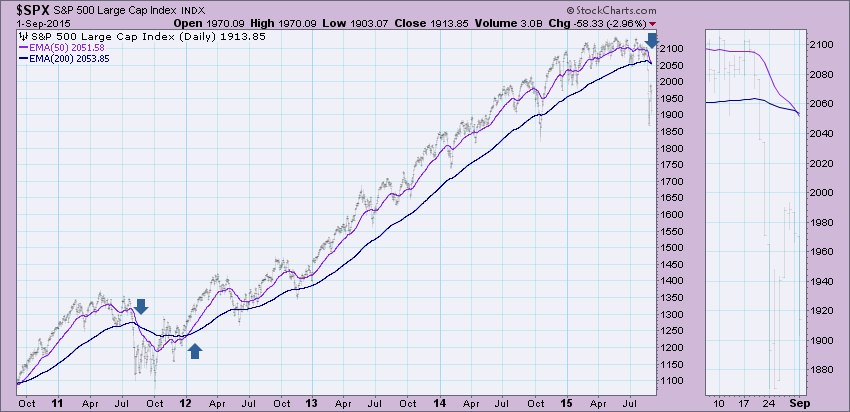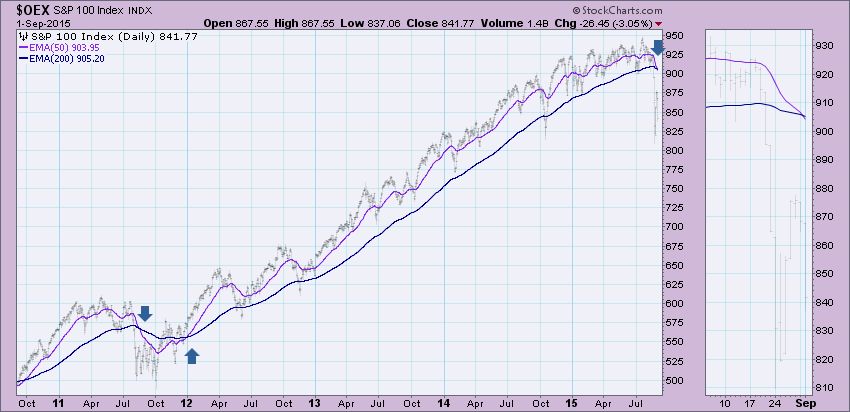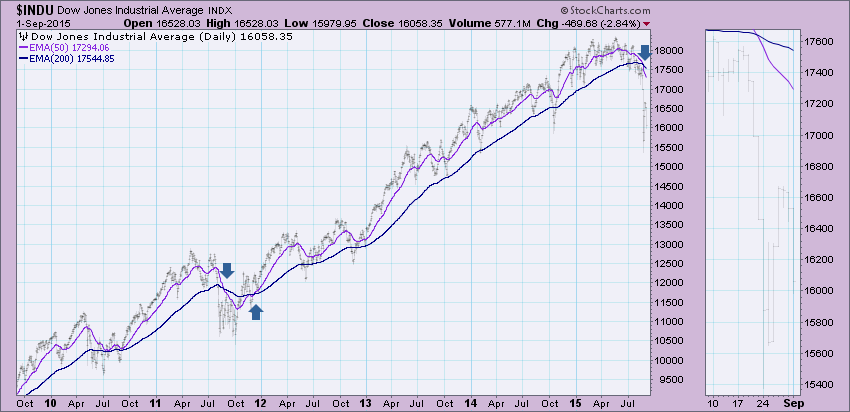
 We had two VERY important signal changes today! Both the S&P 500 and S&P 100 generated Long-Term Trend Model SELL signals. This is very serious, especially given that the Dow Industrials already received a LT SELL signal on August 21st. I've gotten many emails and blog comments that basically ask the question, "Why is this a bear market and not an October-like correction?" Let me explain why I believe this is more serious than October using DecisionPoint models and charts.
The summary of the DecisionPoint Scoreboards, found in the DP Chart Gallery, is below:
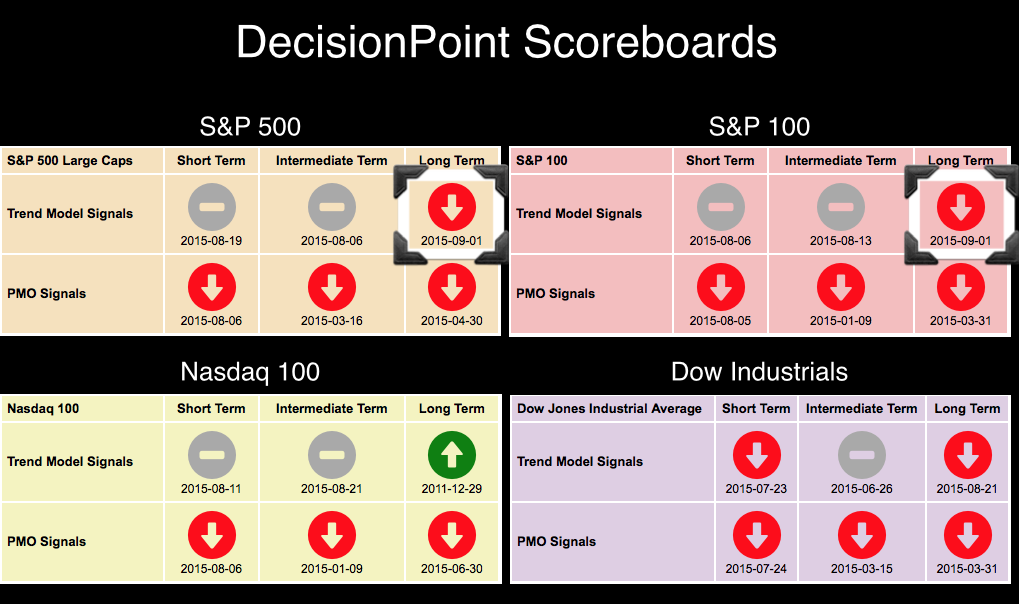
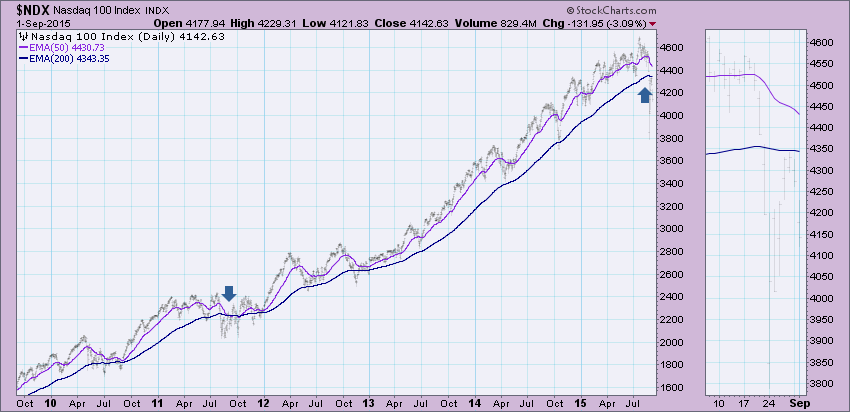
I highlighted the two new Long-Term Trend Model (LTTM) SELL signals. Note that the only green left on the scoreboards is $NDX. Below are long-term daily charts for all four indexes with the 50/200-EMAs highlighted. Remember that DecisionPoint considers a 50/200-EMA negative crossover as the beginning of a bear market for that stock/ETF/Index/etc. The last time any of these indexes moved to a 'bear market' on 50/200-EMA SELL signals was back in 2011. It doesn't happen that often.
I'm sure the first thing the bulls will say is that the previous 50/200-EMA crossovers in 2011 didn't exactly pan out. With the exception of the NDX, these long-term signals kept us out of some difficult times and brought us back on board in time to catch the next bull market wave. The other thing you should note, the deep correction we just experienced is far worse. Notice how quickly price got back above the 50-EMA back in 2011. That was the first confirmation needed that the correction was over, a second confirmation of a positive 50/200-EMA upside crossover sealed it. Price will have quite a hike right now on all of these indexes to get back and stay above the 50-EMA as this correction was much deeper than October and 2011.
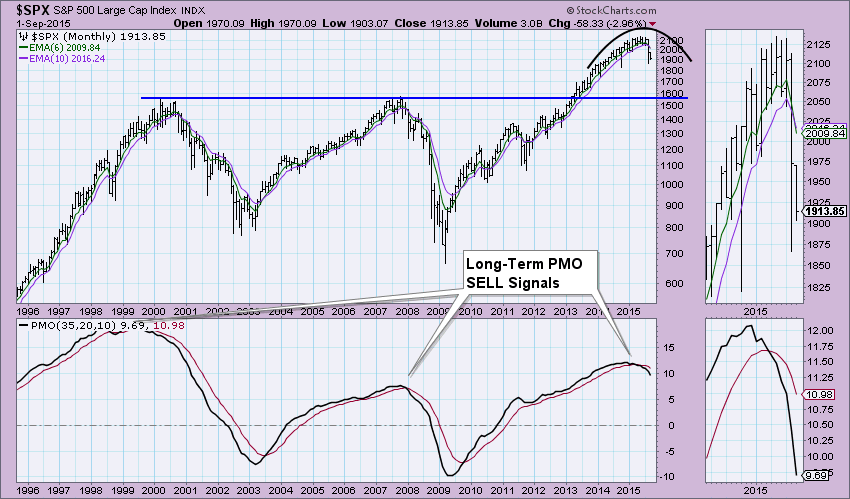
I think the monthly chart for $SPX proves my point that October was a bump in the road, while recent market activity is ominous. Before the crash last week, price had been struggling for quite sometime to reach all-time highs, nearly 4 months. Notice in October, it was preceded by a solid rising trend. There was a 6-week EMA/10-week EMA negative crossover last month that was never a concern in October. However, most troubling is the Long-Term PMO SELL signal. THAT has not occurred since the beginning of the 2008 bear market.
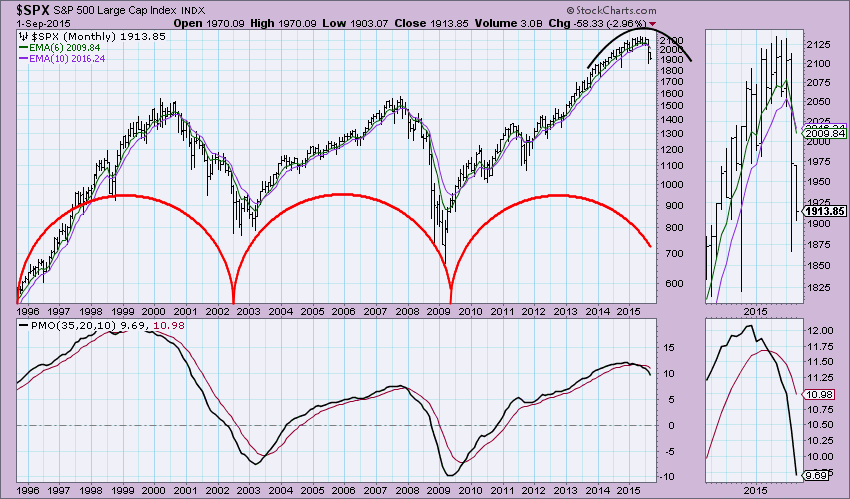
Even cycles are lining up on the monthly chart.
Conclusion: The latest Long-Term Trend Model SELL signals on the Dow, SPX and OEX are outward signs that this is different from October. The positive remaining is the NDX which hasn't had a 50/200-EMA downside crossover. I believe it will be important to keep an eye on this index; not only for a new LTTM SELL signal but possibly for price to settle back above the 50-EMA which could be a bellwether for the other indexes that a long-term bear market may be averted. Please join me on Wednesday for the new "DecisionPoint Report with Erin Heim". We've changed the format to a 30-minute program that will be a DecisionPoint analysis of current market headlines and signals. This will be a quick, yet detailed summary program brought to you on Wednesdays for a mid-week review and on Fridays for the weekly review. Shows start at 7:00p EST. You can find the sign-up link in the "What's New" section of the homepage.
Technical Analysis is a windsock, not a crystal ball.
Happy Charting!
- Erin

