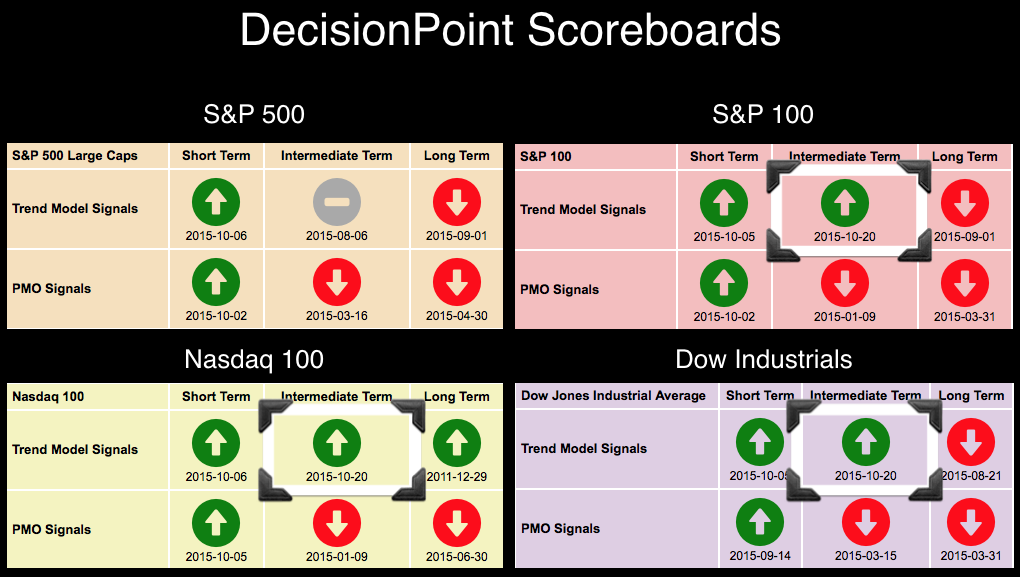
The bear market rally has now extended to Intermediate-Term Trend Model BUY signals. You'll see in the DP Scoreboards below that the Nasdaq 100, S&P 100 and Dow flipped to BUYs. Don't belittle the S&P 500 for staying Neutral, it is hundredths of a point away from joining the party. It is time to look at the charts and determine whether the characteristics are bear market rally or new bull market.
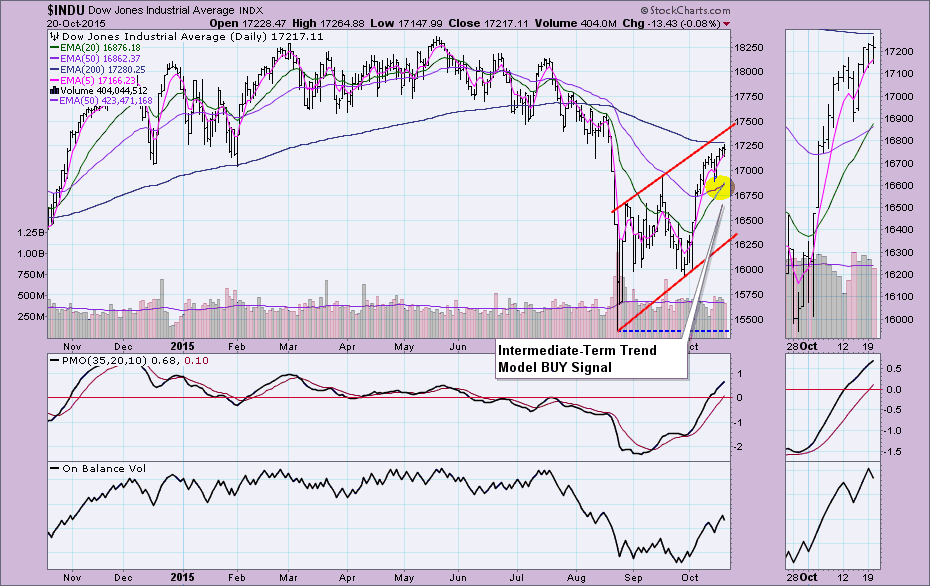
The Dow is almost in a rising trend channel depending on how you choose to draw your trendline. You can see the 20/50-EMA crossover Intermediate-Term BUY signal in yellow on all of the charts below. The Price Momentum Oscillator (PMO) is rising strongly and with a reading of .68, it isn't that overbought since the range typically for the Dow is between 2 and -2. Price has now reached possible overhead resistance at the 200-EMA and the top of the rising wedge (or trend channel).
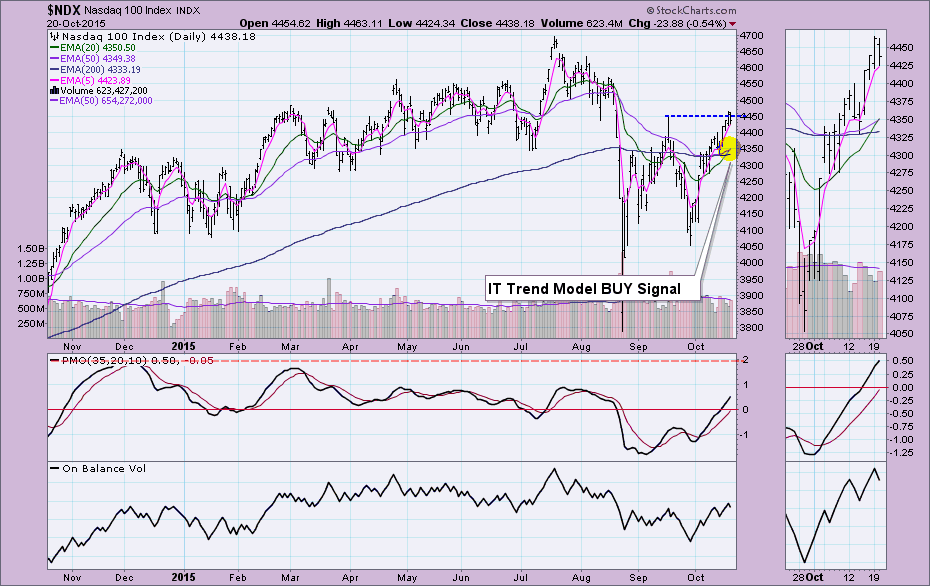
Although the Nasdaq 100 has not had a negative 50/200-EMA crossover to put it officially in a bear market, it is the only index still struggling to overtake its September high. All of its EMAs are now within very close proximity of each other which makes the NDX more vulnerable to whipsaw signals. The correction for the NDX was not as deep as other indexes, so a rally above overhead resistance will be significant.
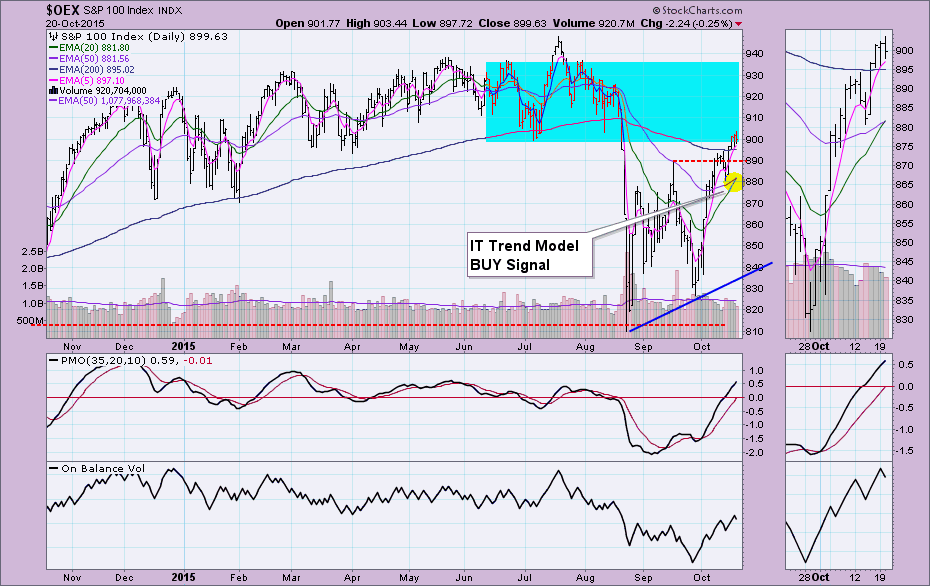
The margin between the EMAs on the S&P 100 isn't as small as that of the NDX. Price also passed its September high over a week ago. Additionally, price has been trading above the 200-EMA for three days. However it is now beginning to enter an area of price congestion that could act as overhead resistance.
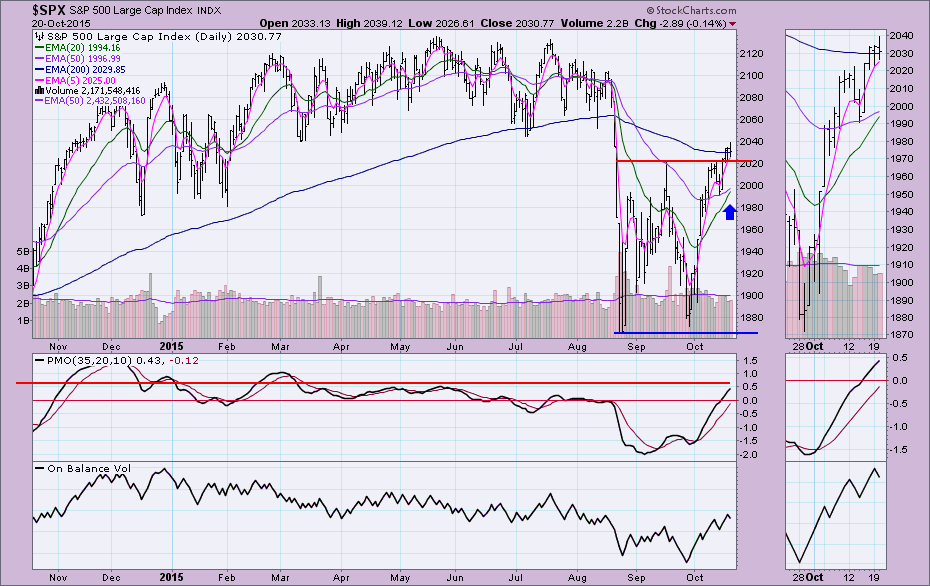
The S&P 500 has broken above the September high and has closed above the 200-EMA (barely) three days in a row. The PMO is beginning to hit somewhat overbought territory and like the OEX, it is nearing a similar area of price congestion that could form overhead resistance, or at least make the rally more difficult to maintain. You can see that it is only a day or two away from an Intermediate-Term Trend Model BUY signal.
Conclusion: It started as Short-Term bullish attention grabbers on the DP Scoreboards and now three indexes are showing intermediate-term bullishness. On all of the charts, price is entering an area of overhead resistance defined by the consolidation of the first of the year. All but the NDX are officially in "bear markets" (50-EMA below the 200-EMA). After reviewing my indicator charts (found in the DP Alert blog or similar versions in the DP Chart Gallery), my conclusion to the DecisionPoint Alert blog article today was that we can't ignore the new ITTM BUY signals that could be a sign of a bear market reversal. My caution would be that this still could be an overextended bear market rally that is due to end soon. October seasonally is one of the toughest months (look at last year's!) and indexes are still in bear markets (except the NDX which never switched). Regardless of the medium- term bullish bias, a pullback seems inevitable and this is a great time to have one.
Join me for my Wednesday webinar, The DecisionPoint Report" at 7:00pm EST and we will look at these charts in depth and review indicator charts from the DP Chart Gallery of the OEX this week. You can sign up to attend from the homepage under the "What's New" section.
Technical Analysis is a windsock, not a crystal ball.
Happy Charting!
- Erin


