I recently received an email from a reader who asked me why the neutral signals on the had not turned to red Sell signals. First there is the technical reason and then there are the charts. The technical reason is that our DecisionPoint Trend Model only changes on crossovers. Once the 20-EMA crosses below the 50-EMA, the only crossover possible is a positive crossover which would generate a BUY signal. The neutral signals occurred above the 200-EMA, meaning that at the time of the negative crossover of the 20/50-EMAs, the indexes were in a "Bull Market" (50-EMA > 200-EMA). Our models have a "safety" in that if an issue is in a bull market, we don't want to take a short position. Remember, in a bull market, expect bullish outcomes; in a bear market, expect bearish outcomes. The model positions us to miss the losses of the downtrend, but keep us from shorting what may not be a productive signal.
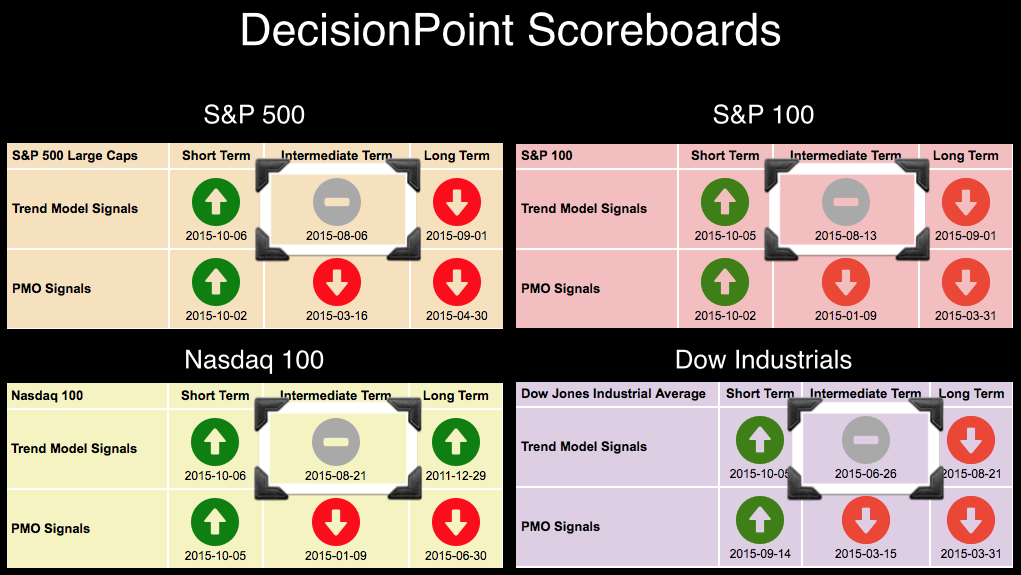
When you observe the charts of these indexes, you can see that the last negative 20/50-EMA crossover occurred above the 200-EMA which is why the signals are neutral and not bearish. Granted, we would have profited greatly shorting when those signals came to be, but at the same time we are in cash or fully hedged and have thus protected our assets. Since I have these charts up, let's do a quick analysis.
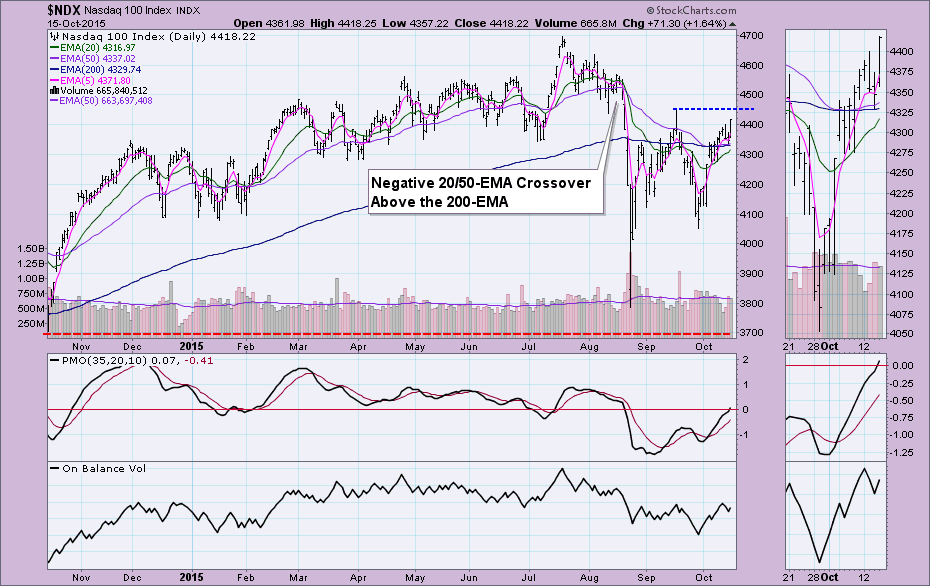
Today's rally on the NDX didn't quite get to overhead resistance at the September high, but price is still carrying positive momentum demonstrated by the Price Momentum Oscillator (PMO). I would've liked to have seen more of a jump on the OBV and if you go to the DecisionPoint Chart Gallery, you'll see that the short-term indicators are in decline and neutral, suggesting lower prices.
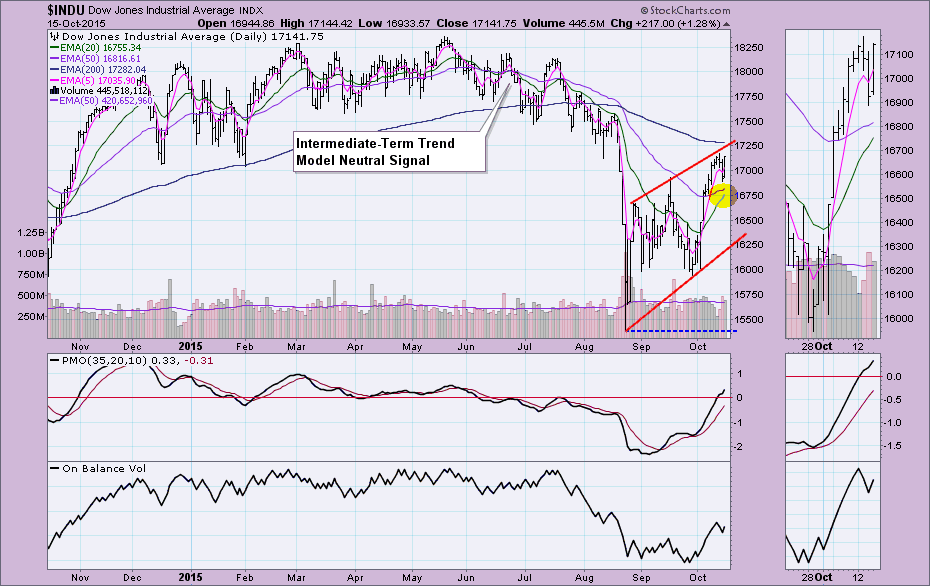
The neutral signal on the Dow is in the balance as the 20-EMA is very close to a positive crossover the 50-EMA. The large rising wedge isn't bullish and the appearance of a rounded top despite today's rally should prevent bullish euphoria.
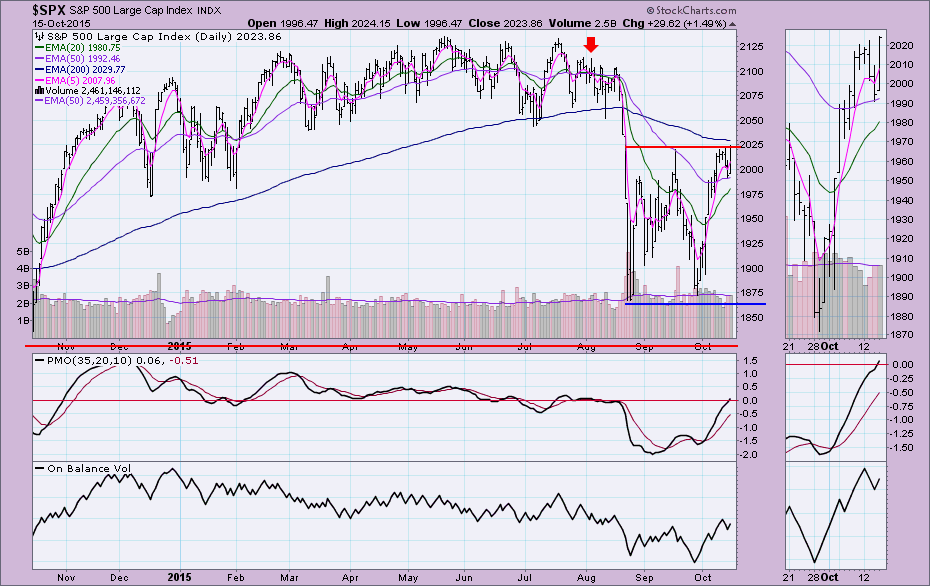
The SPX was stopped and closed right on overhead resistance at its September high. The price pattern is in a large trading range at the moment. Friday will show us more, although it is options expiration and typically we don't see much price action even though it is accompanied by very high volume.
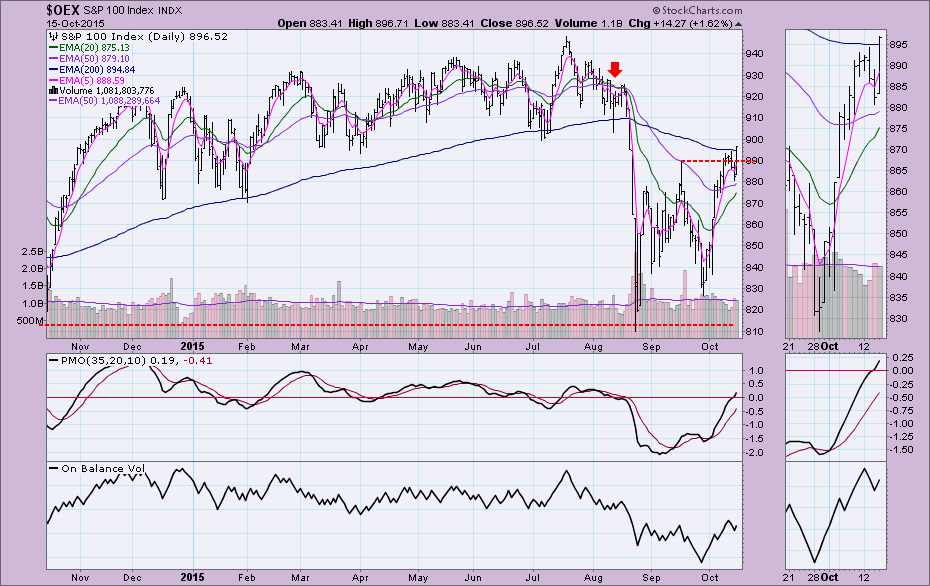
The OEX on the other hand shows a breakout not a rounded top. It is also nearing a positive 20/50-EMA crossover. I attempted to draw trend lines to see if there is a wedge but I was only able to see a broadening pattern which has no real expectation of direction. Clearly this is the strongest of the four in terms of price pattern and EMA placement.
Conclusion: Neutral signals once triggered can only be changed to a BUY signal. The neutral signals are now in jeopardy on most of these indexes, so they may indeed switch to BUY signals. I invite you to join me for my DecisionPoint Report webinars where we review all of these charts as well as the indicator charts for one of the indexes (this week is the NDX). You can sign up from the homepage in the "What's New" Section.
Technical Analysis is a windsock, not a crystal ball.
Happy Charting!
- Erin


