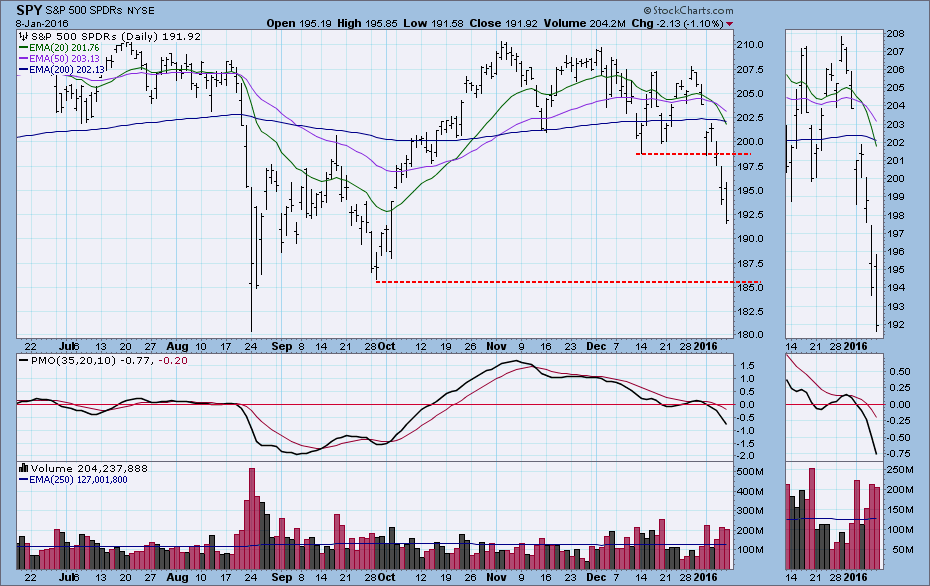
After a particularly brutal week, a lot of people are wondering if the correction is about over. The first place I look is the daily chart to see if there are any obvious support levels coming into play. We can see where price fell through support this week, and the next obvious level of support is still a lot farther down. So, no, there is no nearby price support to possibly get things bouncing next week.
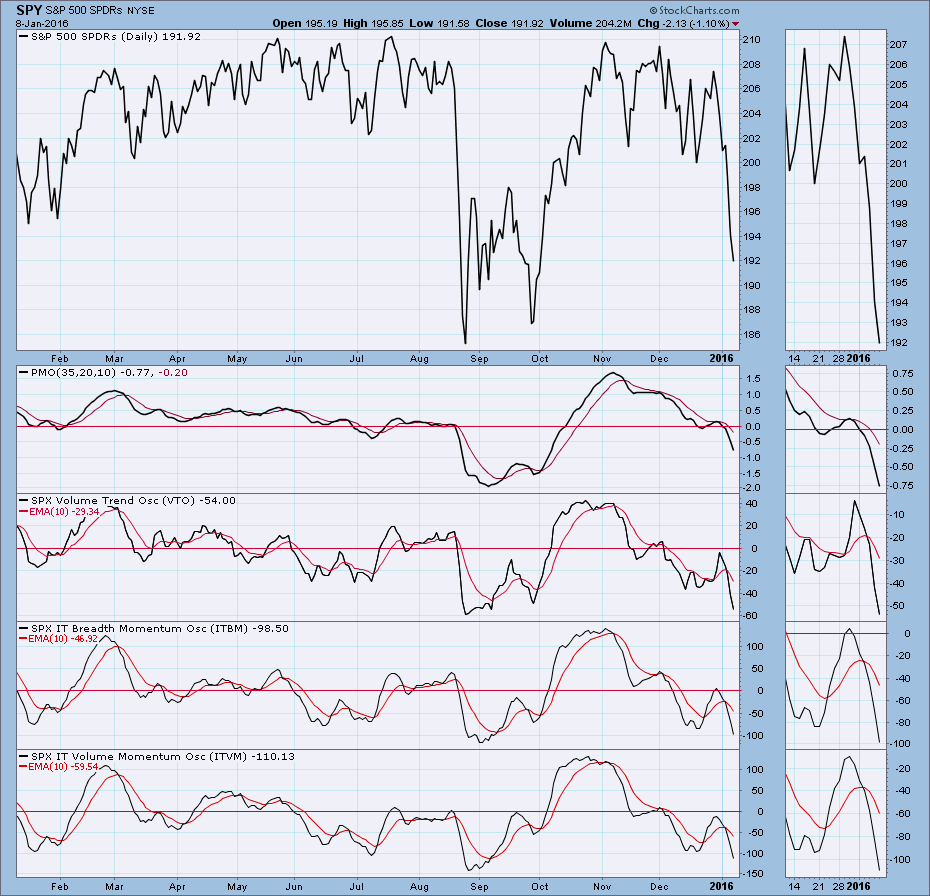
The next area to look would be market internals. Is the market oversold? For this let's look at a set of medium-term indicators. Except for the PMO, these indicators are at levels that have resulted in oversold bounces over the last year, so there is some hope here that the decline could end soon. But now let's get a look at the historical range of these indicators.
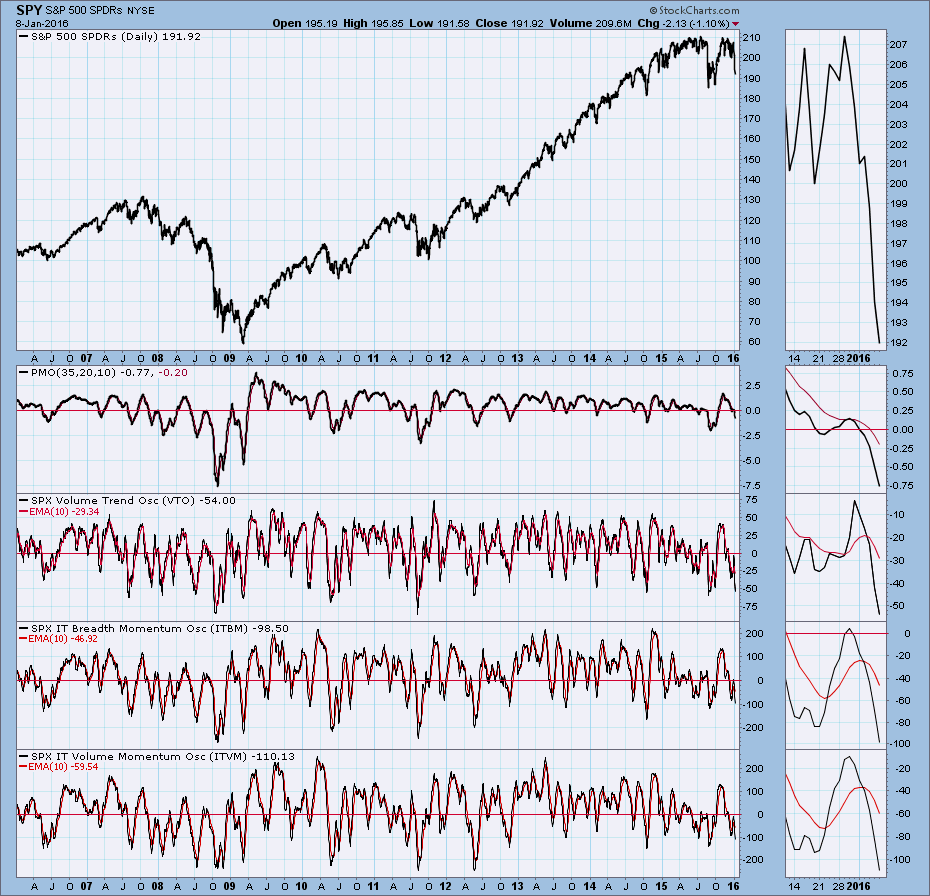
Here is a 10-Year chart of the same set of indicators, and it is obvious that they all have the plenty of room to fall before they begin to challenge the lower limits of their historical ranges. They are oversold, but not painfully so.
CONCLUSION: It is my assessment that the decline is not over yet. There is no obvious price support, and the internal condition is not so oversold that prices can't go lower. A PMO bottom on the daily chart would be the first sign that a price bottom could be forming, but remember that this is a short-term indication.
Technical analysis is a windsock, not a crystal ball.


