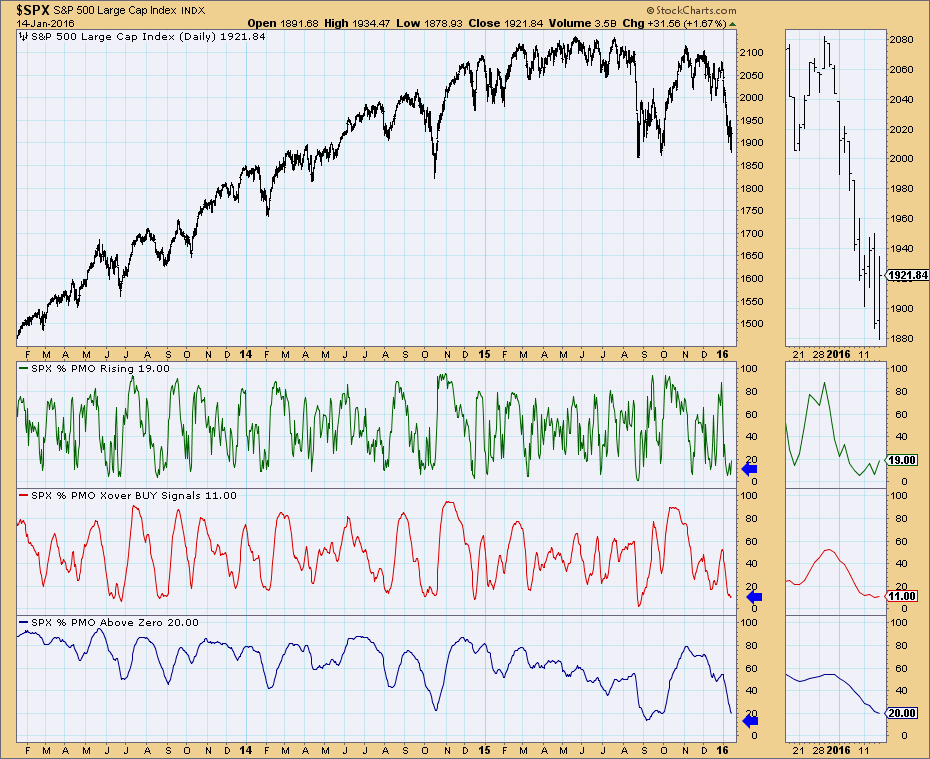
First, I am not encouraging anyone to buy stocks in a bear market. If you are evaluating investments in a bear market, you do need to keep a few things in mind. In a bear market the majority of stocks are in decline (hence it being a bear market). Check out the Price Momentum Oscillator (PMO) Analysis chart below. Of all of the 500 stocks that make up the S&P 500, only 19% have rising PMOs and only 11% are on PMO BUY signals. Our chances of finding a good PMO BUY signal in the S&P 500 are very very slim. This chart is probably one of the best examples of why it is so hard to find a profitable buy in a bear market.
However, despite the small amount of bullish stocks, a StockCharts.com scan will find those select few that are out there on PMO BUY signals or nearing one. Additionally, we can scan almost the entire universe of stocks on StockCharts.com, not just the S&P 500. The PMO scan that I ran today produced about 15 charts. That's one nice thing in a bear market, you aren't going to get a plethora of stocks to review. Unfortunately, what we do get may not be worthwhile. The scan I used is below:
[type = stock] AND [Daily SMA(20,Daily Volume) > 50000]
AND[today's PMO Line(35,20,10)<today's PMO Signal(35,20,10)]
AND [today's PMO Line(35,20,10) > yesterday's PMO Line(35,20,10)]
AND [yesterday's PMO Line(35,20,10) > 2 days ago PMO Line(35,20,10)]
AND [2 days ago PMO Line(35,20,10) > 3 days ago PMO Line(35,20,10)]
AND [today's ema(50,close) > today's ema(200,close)]
and [exchange is not Toronto]
and [exchange is not LSE]
and [exchange is not CDNX]
This scan looks for stocks that are in bull markets themselves (50-EMA is above the 200-EMA) and have had a rising PMO for three days, but no positive crossover yet. Here are three charts that I'll name, "The Good", "The Bad" and "The Ugly". Recall that all three of these charts were in my scan results. Let's start with the worst and move up to the "best" (I use the term loosely).
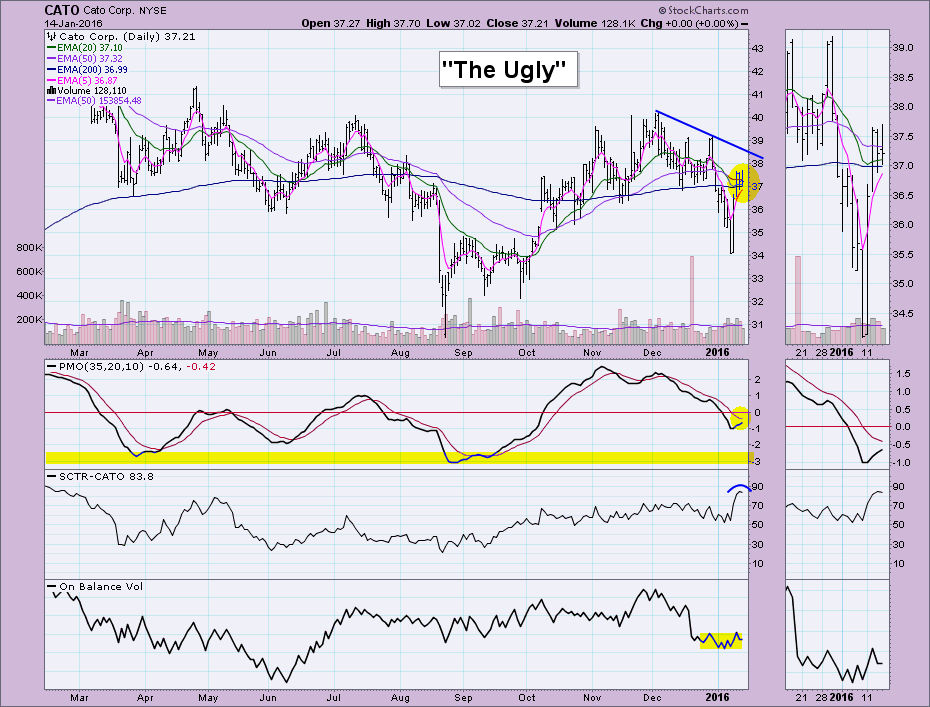
The Ugly: I called this one ugly based on what I've highlighted. First all four of the EMAs are very close together, so while this stock is in a "bull market" now, it could very easily move bearish given the proximity of the 50/200-EMAs. Second, price has not broken out above the declining tops line. Third, the PMO while it is nearing a positive crossover, is in Neutral territory, not oversold territory. That isn't necessarily going to prevent me from initiating a BUY in a bull market, but we need everything to be perfect if we are going to invest in a bear market (which again I don't think is a good idea). The SCTR looks like it is topping even though it is a good reading. Volume has been flat and not behind the recent price rise.
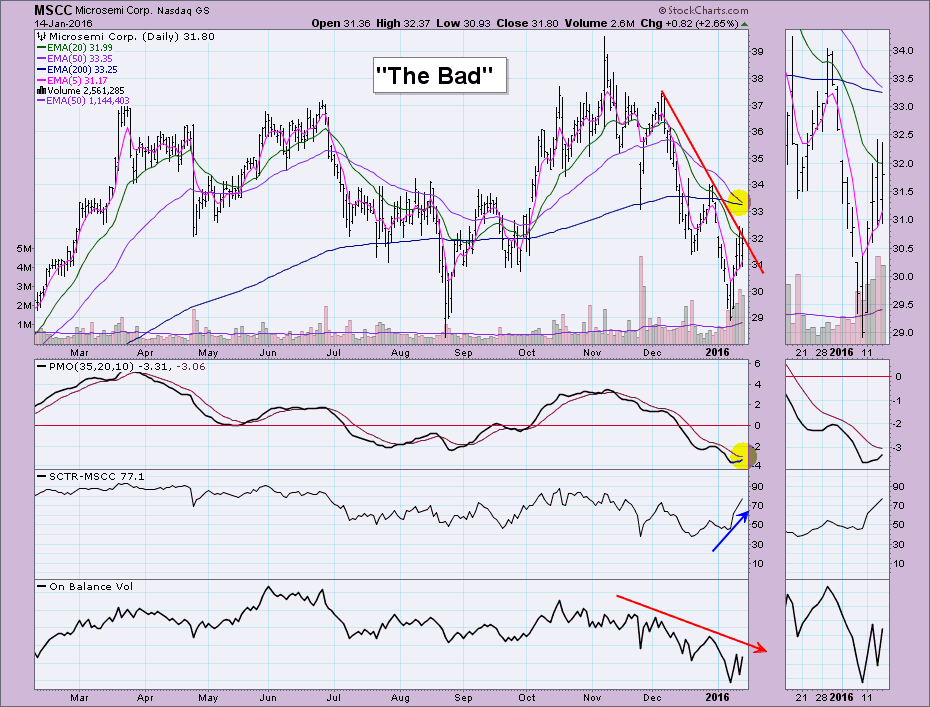
The Bad: First this stock is about to enter a Bear Market which honestly could scratch it off the list right away. It did however, almost close above declining tops resistance and the PMO (should it cross over) is in very oversold territory. The SCTR value is rising but given the declining OBV and its lack of response during this last rally, leaves this chart listed as 'bad'.
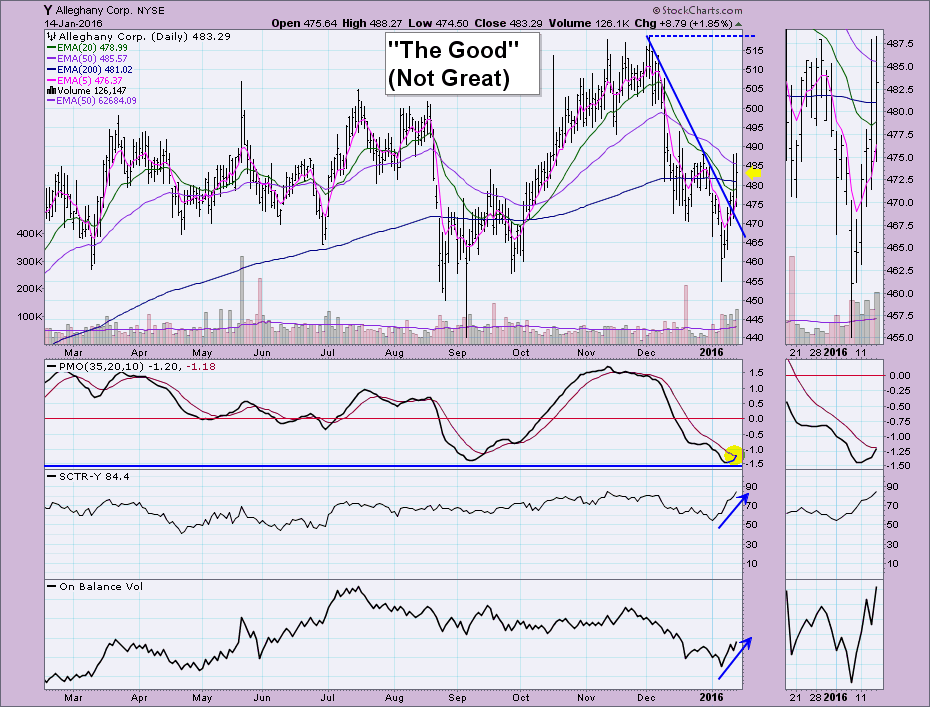
The Good: This isn't a great chart, but it has promise. I'd love it in a bull market, but in a bear market...not as confident. Remember picking a winner right now has about a 2 in 10 chance of being good (the PMO Analysis chart showed us that there were only 19% of S&P 500 stocks with rising PMOs and only 11% that have PMO BUY signals). Price broke out above declining tops resistance and the next area of overhead resistance is at the December top. 5-EMA is nearing a positive crossover the 20-EMA which would trigger a Short-Term Trend Model (STTM) BUY signal. The 50-EMA is above the 200-EMA so it is in a bull market. It is not favorable that the 50-EMA is making a move toward the 200-EMA, but as soon as price closes above the 50-EMA that will no longer be a concern. The PMO is nearing a BUY signal in oversold territory. The SCTR and OBV are trending higher which is bullish.
Conclusion: The purpose of this blog article is not to give you investment recommendations or suggest investments, but to help you understand that the likelihood of finding a profitable BUY in a bear market is slim and IF you are looking, you should be conscious of the strength of the overall market. Even the best charts and signals don't pan out in a bull market, let alone a bear market. Be true to your methodology and remember to apply bear market rules.


