I received a comment on one of my blog articles from a long-time follower, John Latta. Here's what he asked:
"Did you read Arthur's Monday blog? It would be very interesting if you would do an analysis of RSP, especially in view of the divergence from the SPY or SPX which he pointed out."
In answer to his first question, "yes". I've learned so much from reading Arthur's material as well as all of the other fine bloggers we have on StockCharts.com.
So by request, I'm going to give RSP a "DecisionPoint" style review. To analyze any of the SPDRs or equal-weight ETFs that are covered in the DecisionPoint Market/Sector Summary, one only needs to go to the DP Straight Shots ChartPack. It's a free download for Extra members and above. Here is the ChartList for RSP:
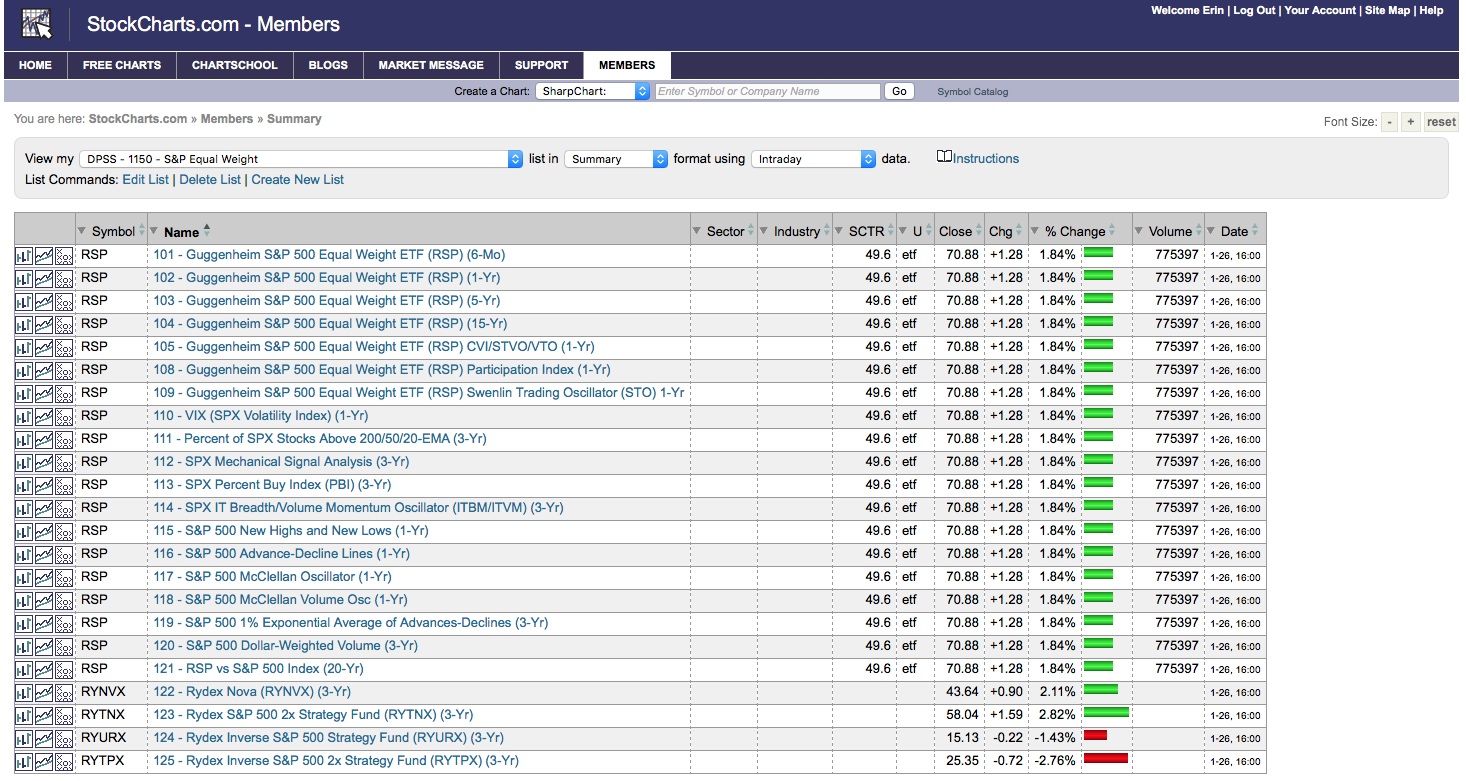 Pretty much all you could ask for, right? I decided I'd review a daily chart, chart #105 (DP's OBV suite of indicators) and chart #122 (Rydex Nova Assets).
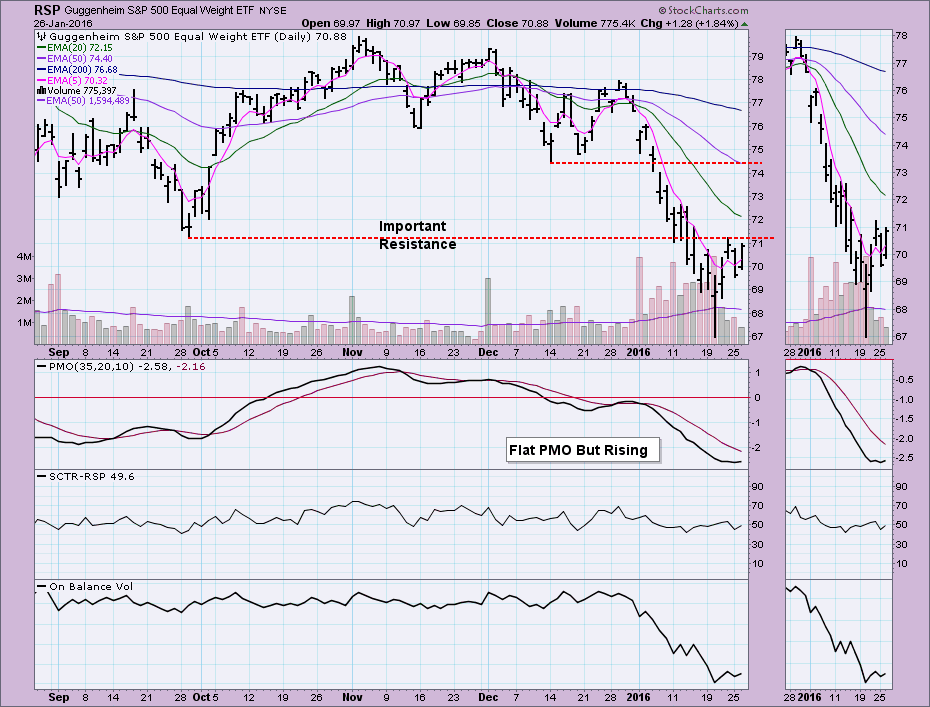
The daily chart below is of the last five months. I opted to curtail the chart from six months to five due to the "Pinocchio" spike from the early August crash, this way we can see all the important areas of support and resistance more clearly. The big concern I have for RSP right now is that it has been unable to penetrate resistance at the September low. This will have to occur if we want to see the Price Momentum Oscillator (PMO) and intermediate-term indicators get out of deeply oversold territory. Momentum is positive based on the rising PMO, but the DecisionPoint Trend Models are configured as negatively as possible with a "SELL" signal in all three time frames (ST/IT/LT).
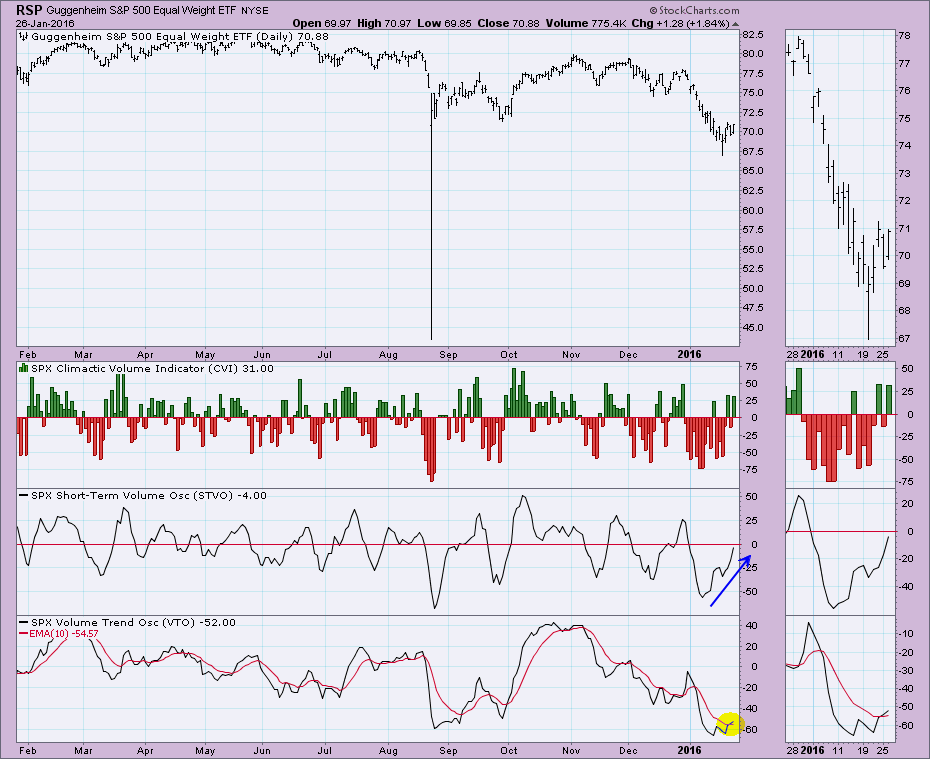
 There are bullish possibilities. The Climactic Volume Indicator (CVI) is showing positive readings, but nothing climactic. Note that when we get especially high or low CVI readings, they almost always occur at important price reversals. The Short-Term Volume Oscillator (STVO) is neutral and rising which is bullish. Our intermediate-term indicator, the Volume Trend Oscillator (VTO) is rising after a positive crossover its EMA. The VTO and PMO are very oversold and need to clear those conditions. That can happen with a rally, but it could also happen with consolidation.
 Here is where the "risk" factor that Arthur alluded to comes in. This is a chart of the Rydex Nova Fund. It mirrors the S&P 500. With the Rydex funds, we can track the assets and cashflow within each fund. It is a great sentiment indicator as it registers 'real' money versus survey answers. Notice that cash is not going into this fund and the assets within are at their all-time lows. We want to see an increase in the assets and cashflow during a rally. It isn't happening yet.
 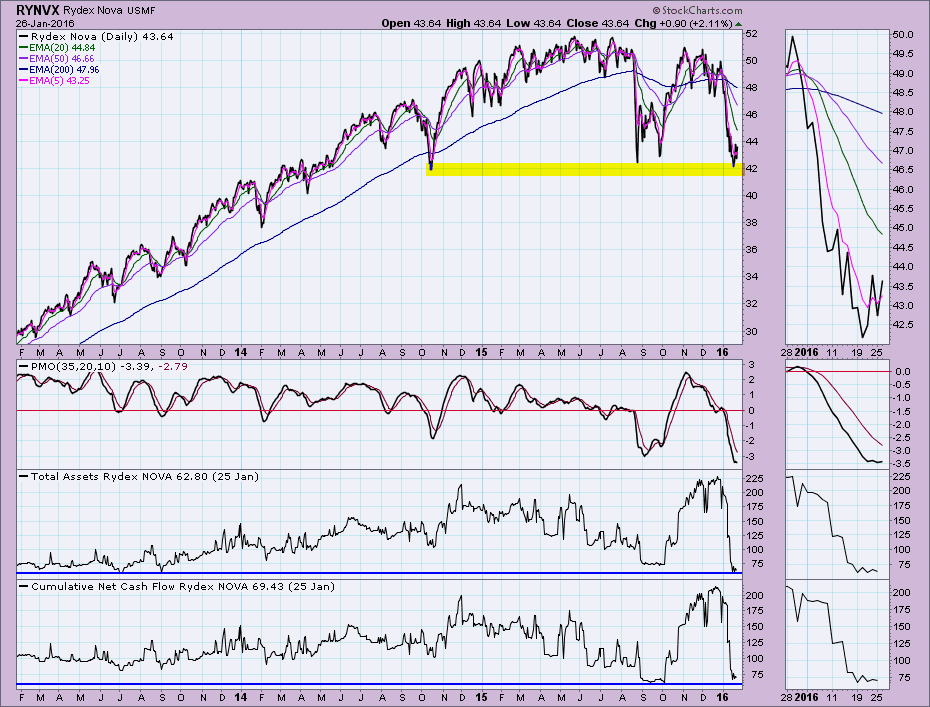 Remember that sentiment indicators are contrarian. The Nova chart suggests a great deal of bearishness and consequently risk aversion based on the assets and cashflow. In the long run that could be good as it could set up a more robust rally than the bounce we have already experienced.


