What, what? A new Long-Term Trend Model (LTTM) BUY signal for XLF? Indeed. Yet, how bullish is the Financial sector in the short, medium and long terms? After reviewing the daily, weekly and monthly charts, the conclusion is that the Financial sector may not be as robust as this signal implies.
What triggers a LTTM BUY signal? When the 50-EMA crosses below the 200-EMA, the LTTM will trigger a SELL signal. In this case, when the 50-EMA crosses above the 200-EMA, it is a BUY signal. DecisionPoint analysis suggests that when the 50-EMA is above the 200-EMA, the ETF, index, stock, etc. is in a "bull market" configuration. I have to say though, looking at these charts, I have to question whether this LTTM BUY signal will amount to a long-term rally.
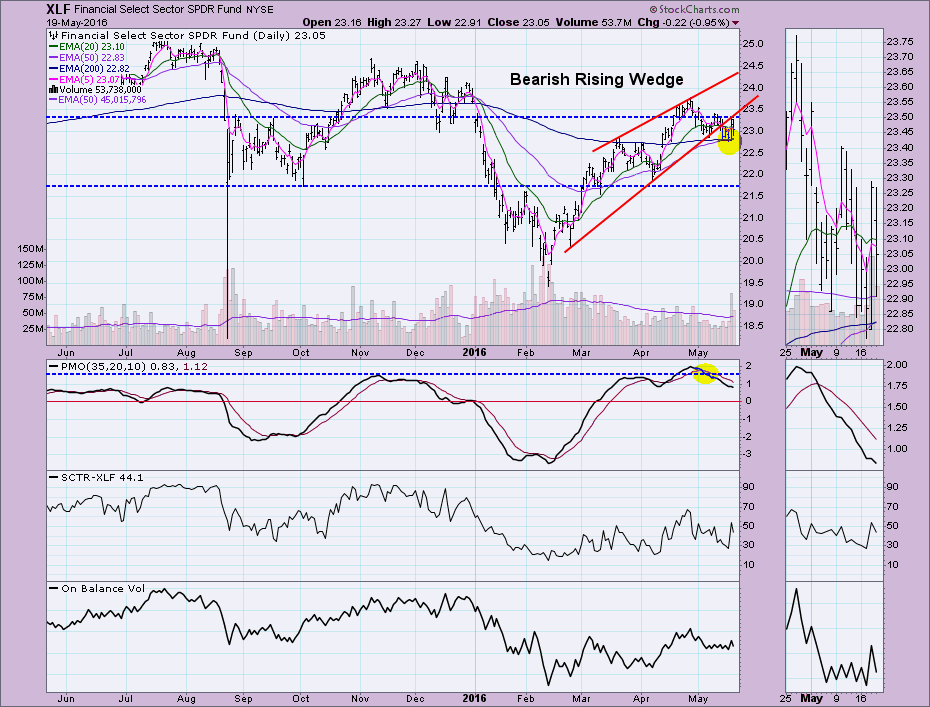
I've highlighted the positive 50/200-EMA crossover. I don't like the "short-term" picture. The 5-EMA is below the 20-EMA (a ST Trend Model Neutral signal) and the Price Momentum Oscillator (PMO) has actually begun to accelerate its descent. The SCTR reading is below average and the OBV line doesn't suggest a rally is approaching. As long as price can remain above the 200-EMA, which it is using as support right now, the LTTM BUY signal will remain intact. I've also annotated a bearish rising wedge pattern. It executed, sort of, when price drifted sideways through the bottom of the wedge. This pattern suggests a breakdown, not a drift out with consolidation. I suspect it will more clearly execute with a breakdown below the 200-EMA.
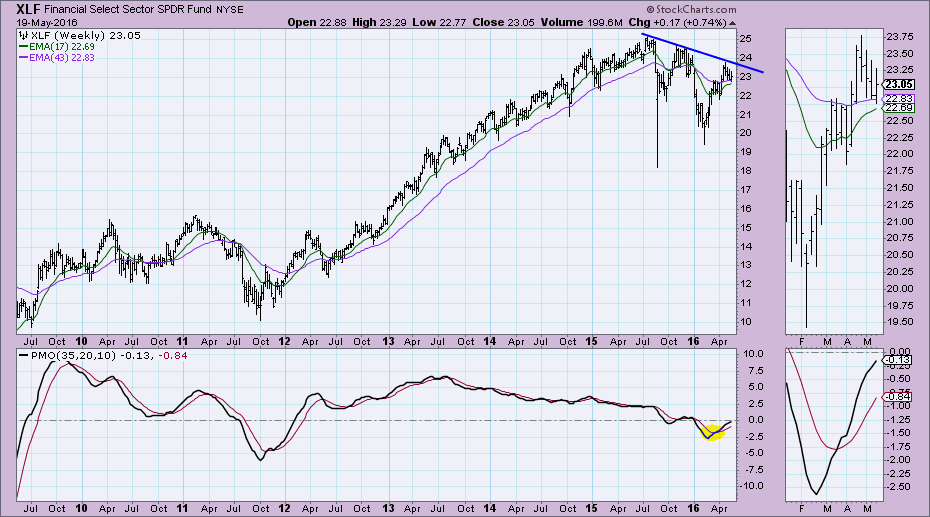
The weekly chart has some bullish aspects to it with a rising PMO that had a positive crossover BUY signal in late April. Price is holding above the 17-week EMA. On the bearish side, price made an attempt to breakout above the declining tops trendline, but it failed and the PMO is still beneath the zero line.
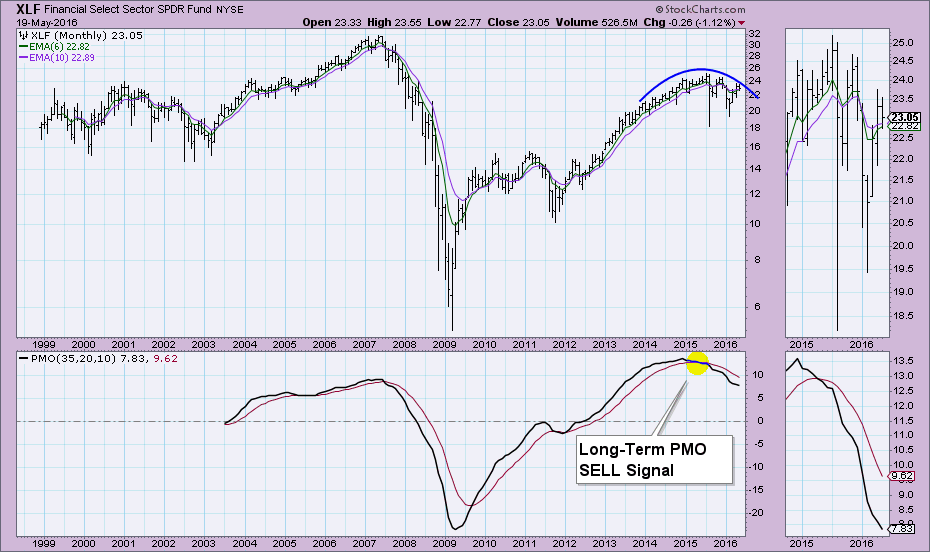
The long-term monthly chart shows a clear bearish rounded top along with a PMO SELL signal that occurred at the top of its range.
Conclusion: XLF did pick up a Long-Term Trend Model BUY signal today, but the charts in all three time frames do not suggest that a long-term rally is on tap or even a short-term rally for that matter. It is more likely that we will see this signal fail soon. This is a prime example of why you can't follow timing signals blindly.
Come check out the DecisionPoint Report with Erin Heim on Wednesdays and Fridays at 7:00p EST, a fast-paced 30-minute review of the current markets mid-week and week-end. The archives and registration links are on the Homepage under “What’s New”.
Technical Analysis is a windsock, not a crystal ball.
Happy Charting!
- Erin


