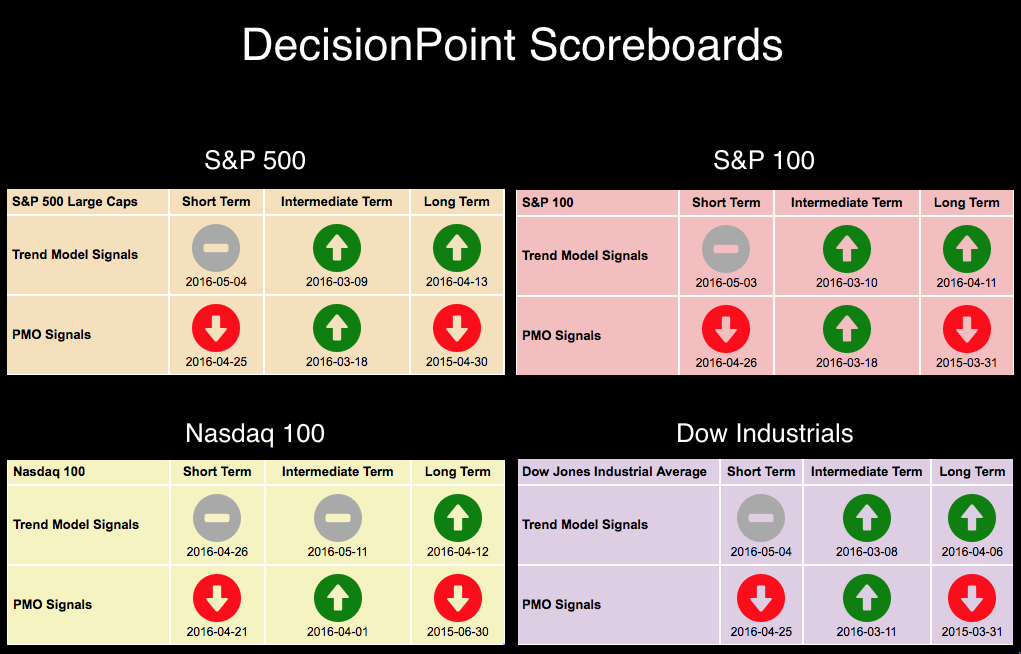
 We haven't seen much change to the DecisionPoint Scoreboards and as they stand now (seen below), the intermediate term is clearly bullish versus the short term which is bearish.
One of the best ways to make a more detailed comparison by index and sector is to use the DecisionPoint Reports blog. This blog is available to members. The DecisionPoint Scoreboards are a visual tool, the DecisionPoint Market/Sector Summary located in the DP Reports blog is also a great visual tool to compare indexes and sectors bull vs. bear leanings.
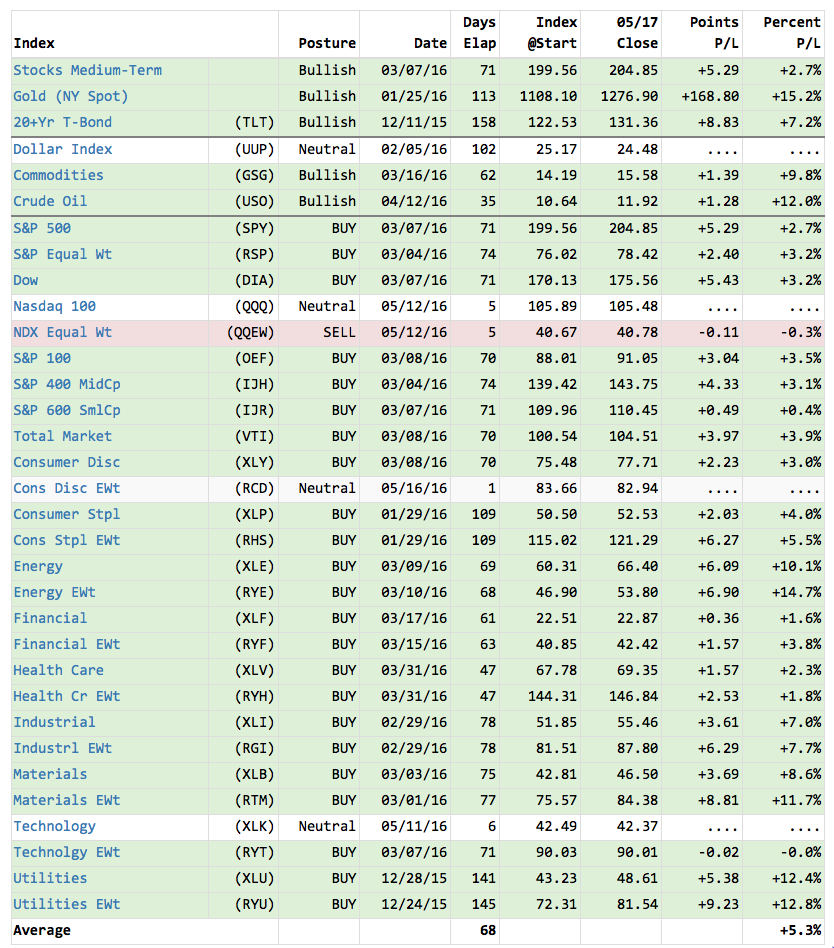
Once in the DP Reports blog, you'll want to click on the DecisionPoint Market/Sector Summary. The very first table is a "temperature" of the intermediate term. It shows, in color, what indexes, sectors, ETFs are on Intermediate-Term Trend Model (ITTM) BUY/SELL/Neutral signals. The ITTM generates a BUY signal when the 20-EMA crosses above the 50-EMA. A Neutral or SELL signal is generated when the 20-EMA crosses below the 50-EMA (a "SELL" if the 50-EMA < 200-EMA, a "Neutral" if the 50-EMA > 200-EMA). Notice that nearly all issues are on BUY signals, some have been on these signals over 100 days. The exceptions have only started to arrive within the last week. Typically, this chart will begin to "roll over" or "flip" to the bearish side before a correction.
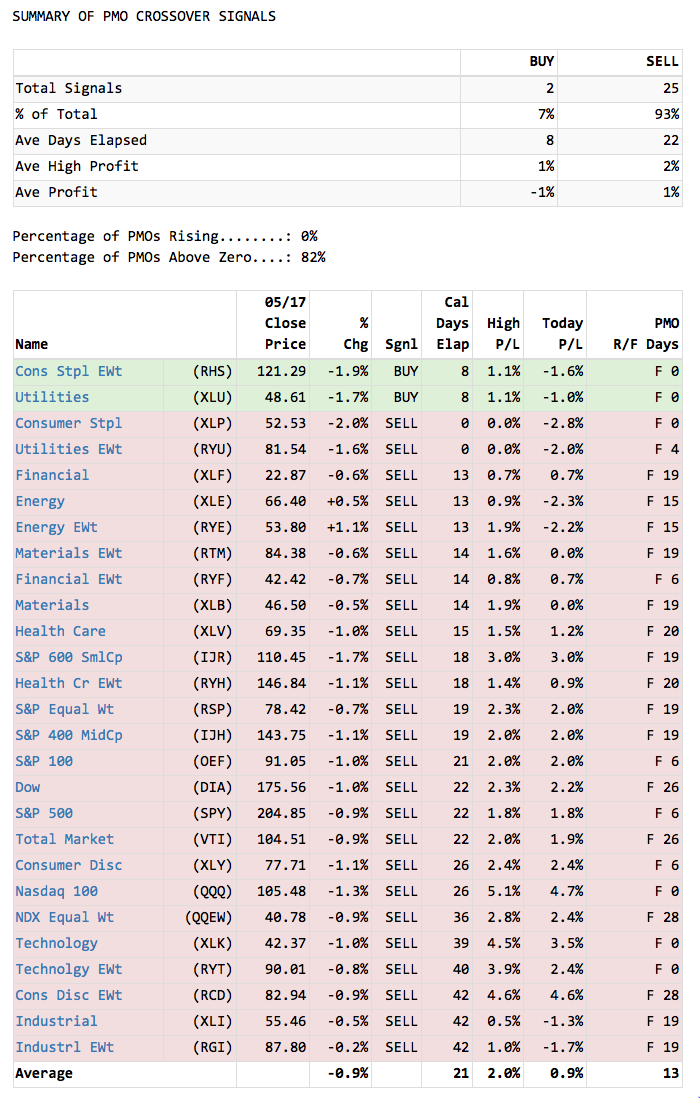
The short term is represented by the summary of Price Momentum Oscillator (PMO) Crossover BUY/SELL Signals table. Notice that nearly all of these are bearish, meaning that most have PMO readings below their signal line. The two new PMO BUY signals arrived eight days ago. The last column of this table displays whether the PMO is rising (R) or falling (F). The two new PMO BUY signals are in jeopardy already as both PMOs turned down today.
Conclusion: For a quick visual read on where the top indexes and sectors are in the intermediate term or the short term, the Market Posture table and the Summary of PMO Signals within the DecisionPoint Market/Sector Summary (found in the DP Reports blog) are there updated daily. If you look at the rest of the report, you'll also find the market and sector indexes sorted by today's percentage change, market indexes ranked by strength, market indicator summary, cycle projections and links to charts recommended for review.
Come check out the DecisionPoint Report with Erin Heim on Wednesdays and Fridays at 7:00p EST, a fast-paced 30-minute review of the current markets mid-week and week-end. The archives and registration links are on the Homepage under “What’s New”.
Technical Analysis is a windsock, not a crystal ball.
Happy Charting!
- Erin


