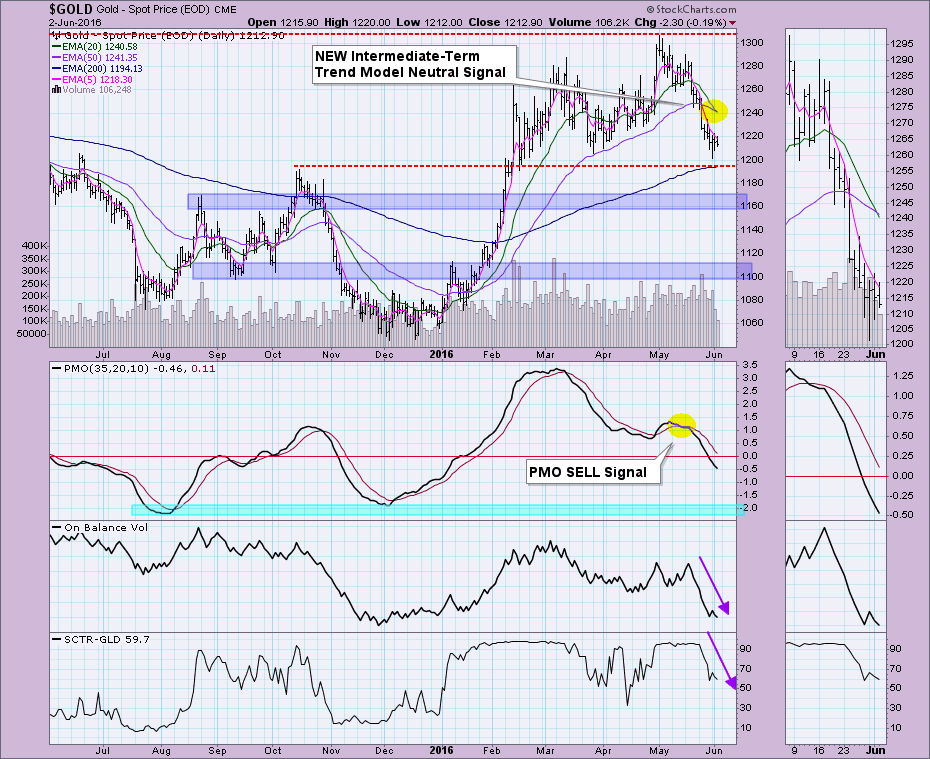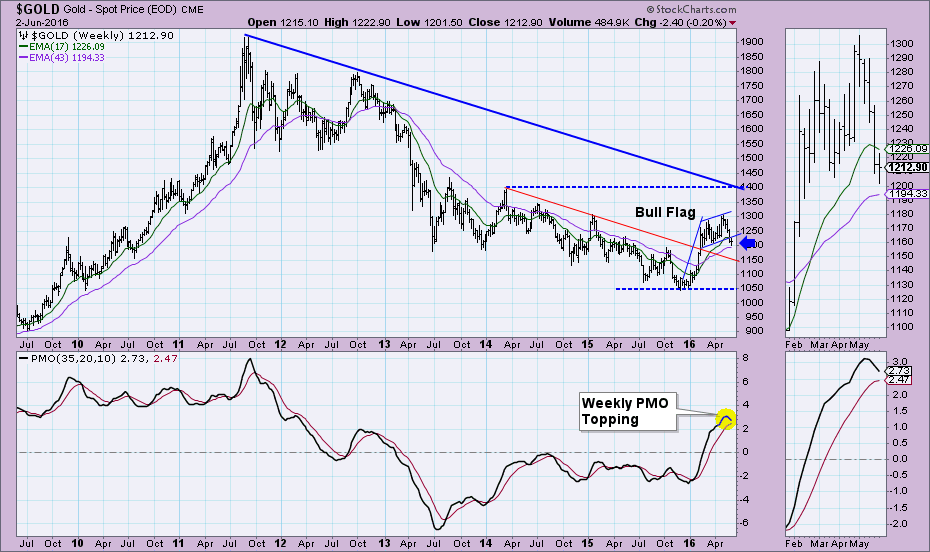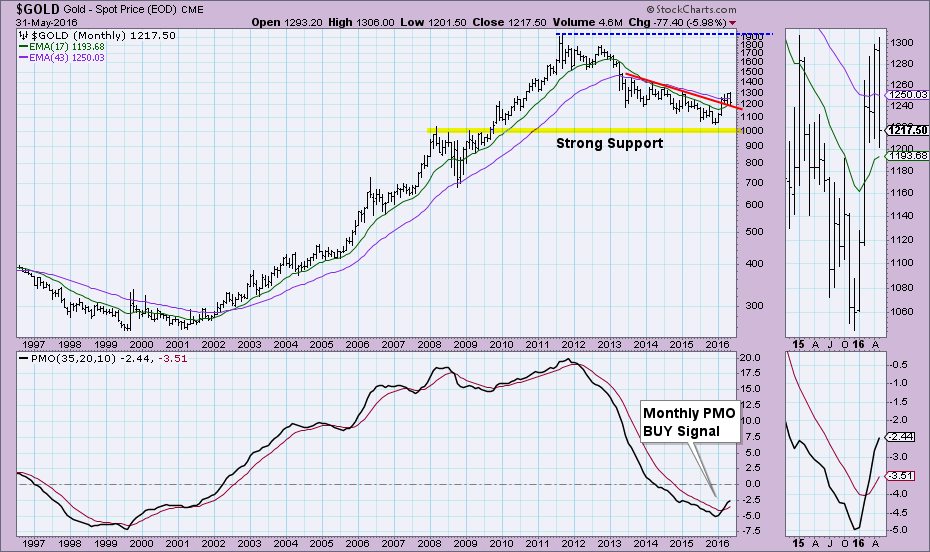
 Today's signal change probably isn't too surprising given the pesky correction that has been plaguing Gold. The question is whether it has arrived late to the party given that price seems to have found short-term support at the October 2015 high. A look at all three time frames is in order.
The 20-EMA crossed below the 50-EMA and that triggered a new Intermediate-Term Trend Model (ITTM) Neutral signal. It was not considered a SELL signal because the 50-EMA is above the 200-EMA. Gold has been in correction mode since the beginning of May and this signal is a product of that. Price found support at the October high and 200-EMA which suggests it may be ready for a recovery. However, the Price Momentum Oscillator (PMO) is on a SELL signal and declining rapidly. The SCTR and OBV do not look promising as far as supporting a rally off of support; they have both been in rapid decline. The PMO is beginning to reach oversold territory, but it is not interested in bottoming yet. I suspect, based on the indicators, that this support line will not hold. If that is the case, clearly the strongest support lies at the December lows, but there are opportunities for price to find support at the August and September 2015 highs or lows.
The weekly chart has not gone final as of today, but it already shows a breakdown from what looked like a bullish flag formation. When you get a bearish result from a bullish pattern that is generally very bearish. The intermediate-term PMO has topped and is nearing a negative crossover its EMA.
The monthly picture for Gold is bullish. The PMO is currently on a BUY signal and price is sitting above declining tops support. I would become concerned if price breaks below the 17-week EMA. Long-term strong support lies at the 2008 highs and psychological support at 1000.
Conclusion: The long-term perspective for Gold is bullish, but the short and medium terms are bearish. The new ITTM Neutral signal implies Gold is likely in for more decline in the shorter and intermediate terms. Further decline would take out current support around 1200. If price breaks down below that, the next support target for the optimists is around 1160 and for the pessimists it is around 1000.
Come check out the DecisionPoint Report with Erin Heim on Wednesdays and Fridays at 7:00p EST, a fast-paced 30-minute review of the current markets mid-week and week-end. The archives and registration links are on the Homepage under “What’s New”.
Technical Analysis is a windsock, not a crystal ball.
Happy Charting!
- Erin


