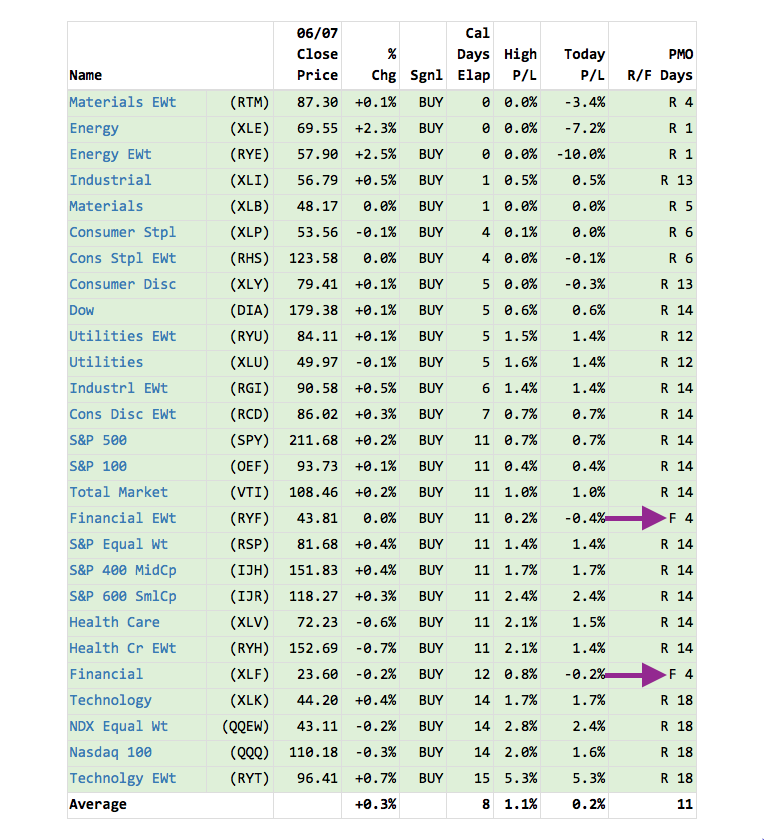
 I have been watching the DecisionPoint Market/Sector Summary Daily Report (located in the "DP Reports" blog) closely, actually, one table in particular. The "PMO Crossover Signals" table identifies whether a particular sector is on a Price Momentum Oscillator (PMO) BUY or SELL Signal. You'll find a snapshot of the table below.
This table is short-term in nature. Notice that all of the sectors are currently on BUY signals. What I like about this table, is that you can see whether the PMO is currently rising or falling, and for how many days. In the last column, note that every sector except the Financial sector have rising PMOs. If the PMO is rising on a BUY signal, that signal is obviously not in jeopardy. However, if it is falling, a crossover SELL signal may be in the works.
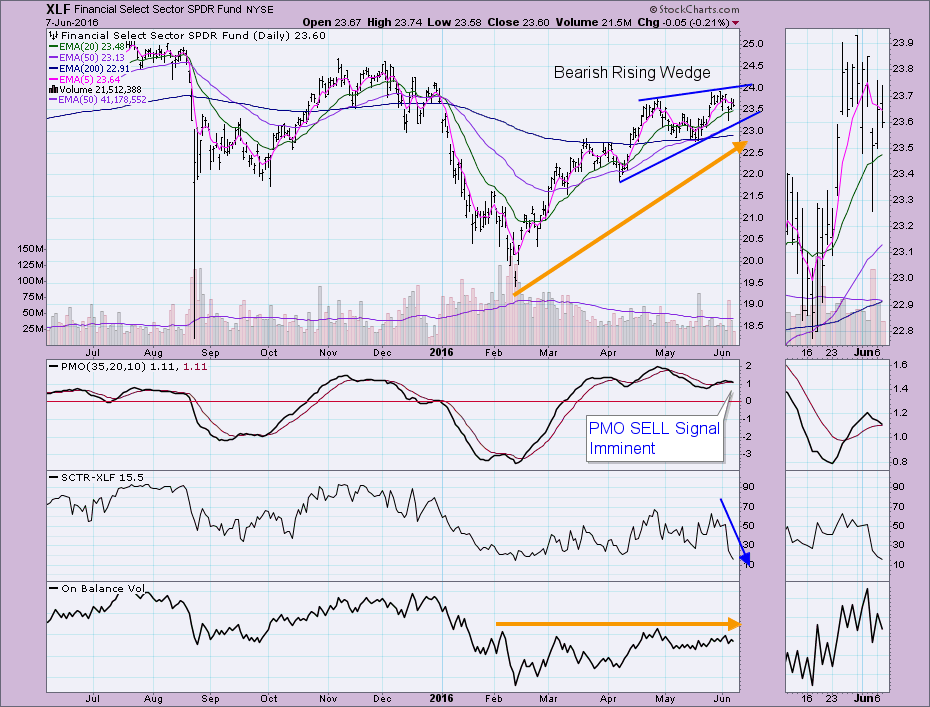
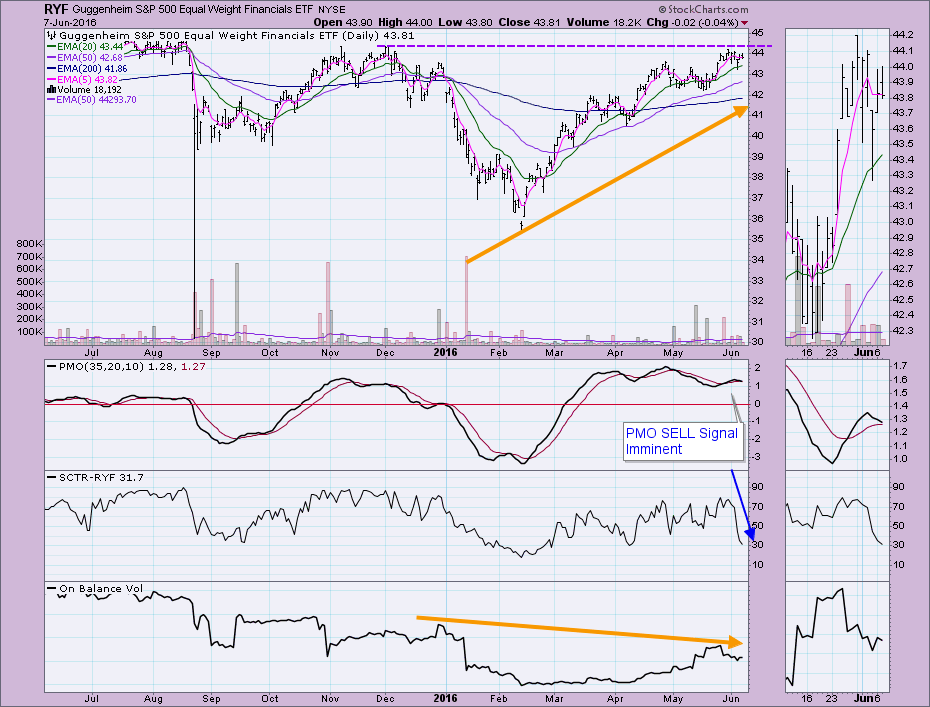
A look at both charts shows us that PMO SELL signal are imminent with the margin between PMO and signal line so thin. Both charts also show negative divergences between the OBV line and price, suggesting volume is not behind the current trend.
XLF in particular also has a bearish rising wedge visible, while RYF shows an unsuccessful test of overhead resistance. The SCTR value for both has tanked.
Conclusion: Using the DP Reports blog "Market/Sector Summary Report", you can identify not only PMO BUY and SELL signals, but you can also determine where the PMO is headed, giving you the opportunity to identify where momentum is currently in relation to the other sectors. The Financial ETFs have lagging momentum. Bearish indications on the daily charts suggest a pullback or decline could be in store for XLF and RYF in the short term.
Come check out the DecisionPoint Report with Erin Heim on Wednesdays and Fridays at 7:00p EST, a fast-paced 30-minute review of the current markets mid-week and week-end. The archives and registration links are on the Homepage under “What’s New”.
Technical Analysis is a windsock, not a crystal ball.
Happy Charting!
- Erin


