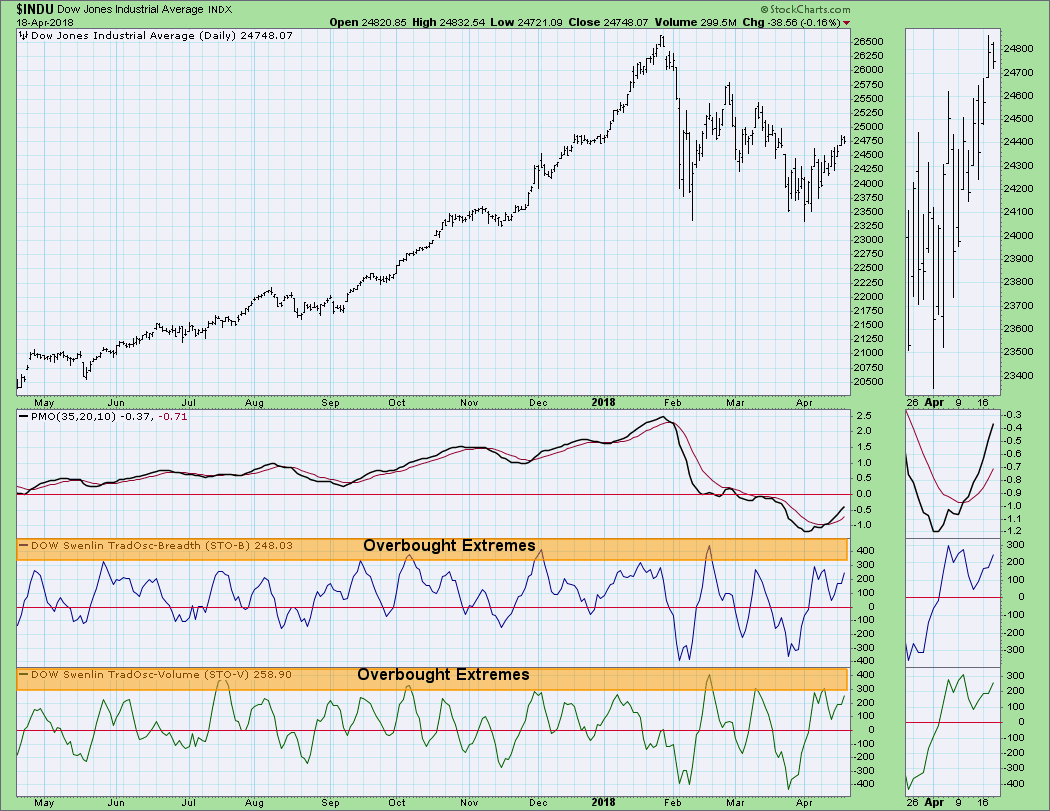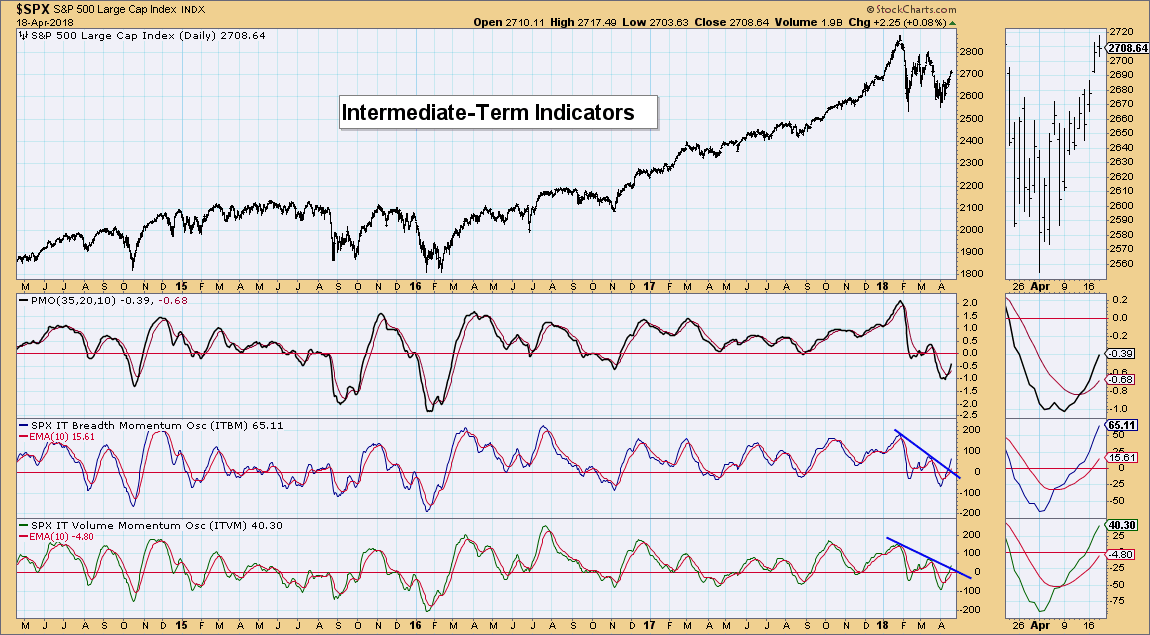
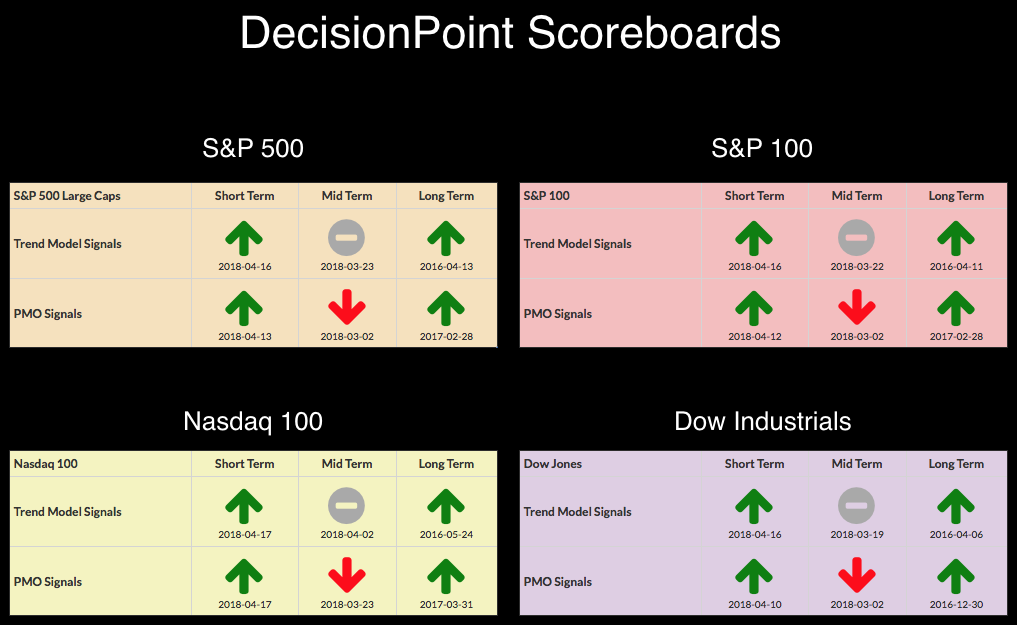
 This week the DP Scoreboards turned short-term bullish. Unfortunately, I suspect this breakout won't hold long if the short-term indicators continue to stretch into very overbought territory. Although the Scoreboards show intermediate-term neutral to bearish, the intermediate-term market indicators suggest we likely have seen the lows for the correction and may very well side-step a bear market. The IT Trend Model signals on the Scoreboards is determined by 20/50-EMA crossovers, so it will take some more time to see those crossovers which is why the ITBM and ITVM indicator set is so useful in conjunction with the Trend Model and PMO.
The purpose of the DecisionPoint Alert Daily Update is to quickly review the day's action, internal condition, and Trend Model status of the broad market (S&P 500), the nine SPDR Sectors, the U.S. Dollar, Gold, Crude Oil, and Bonds. To ensure that using this daily reference will be quick and painless, we are as brief as possible, and sometimes we let a chart speak for itself.
STOCKS
IT Trend Model: Neutral as of 3/23/2018
LT Trend Model: BUY as of 4/1/2016
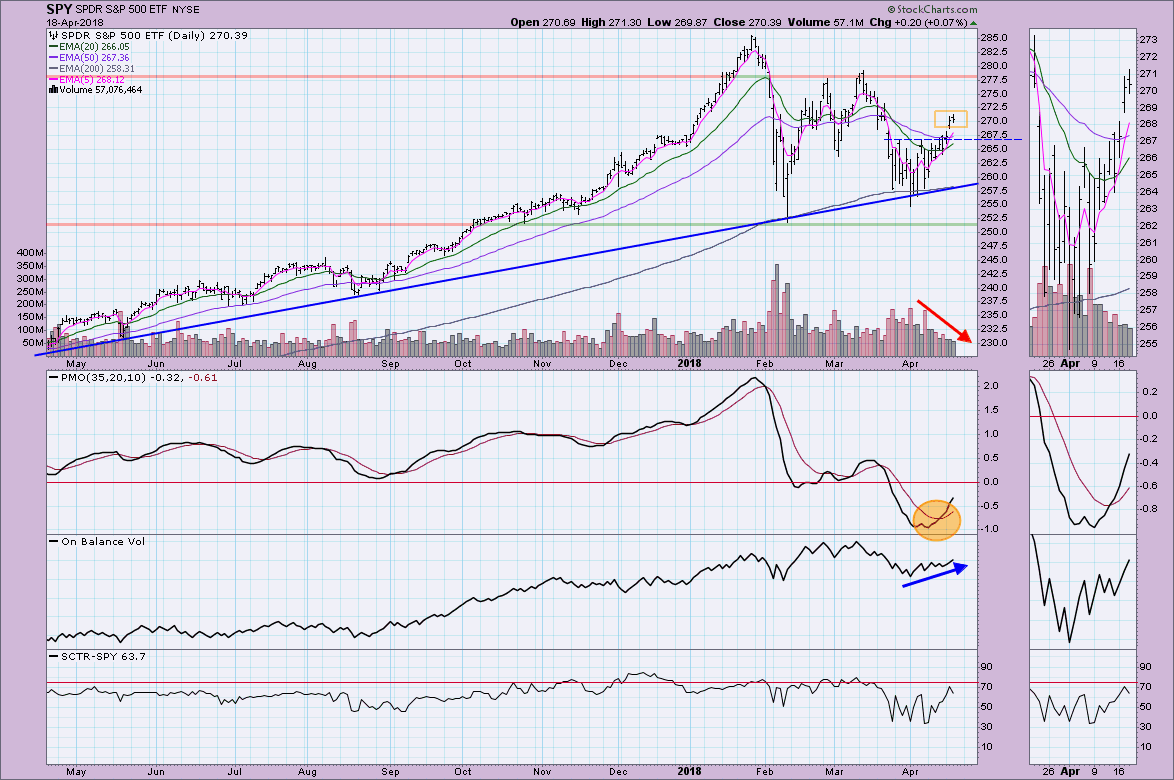
There is certainly more room for price to rise in the short term before it hits overhead resistance at 278. My hope is that the gap formed yesterday is a breakaway gap and not the start of an island reversal. I think it should be noted that since the April low, volume has been trending lower. We don't want to see volume dry up just as the market rallies. Classical TA tells us to expect a reversal. On the bright side, although volume is decreasing, the OBV is staying healthy due to 'up' volume outperforming 'down' volume in the calculation. The PMO and SCTR look healthy as well.
Climactic Indicators:
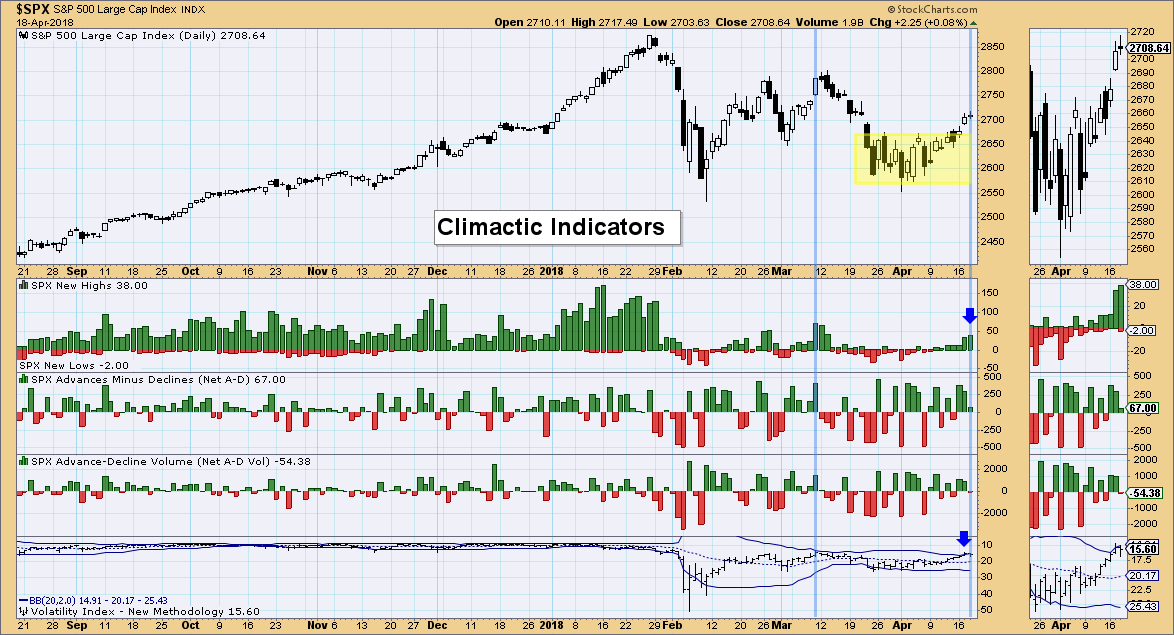
In the very short term, the VIX punctured the upper Bollinger Band on my inverted scale. This typically signals overbought conditions and a likely decline over the next few days. Breadth, as far as New Highs was elevated, but Advances and Declines were not. So while the VIX is suggesting some downside movement in the very short term, breadth isn't confirming. I look at these indicators as mostly neutral for that reason.
Short-Term Indicators:
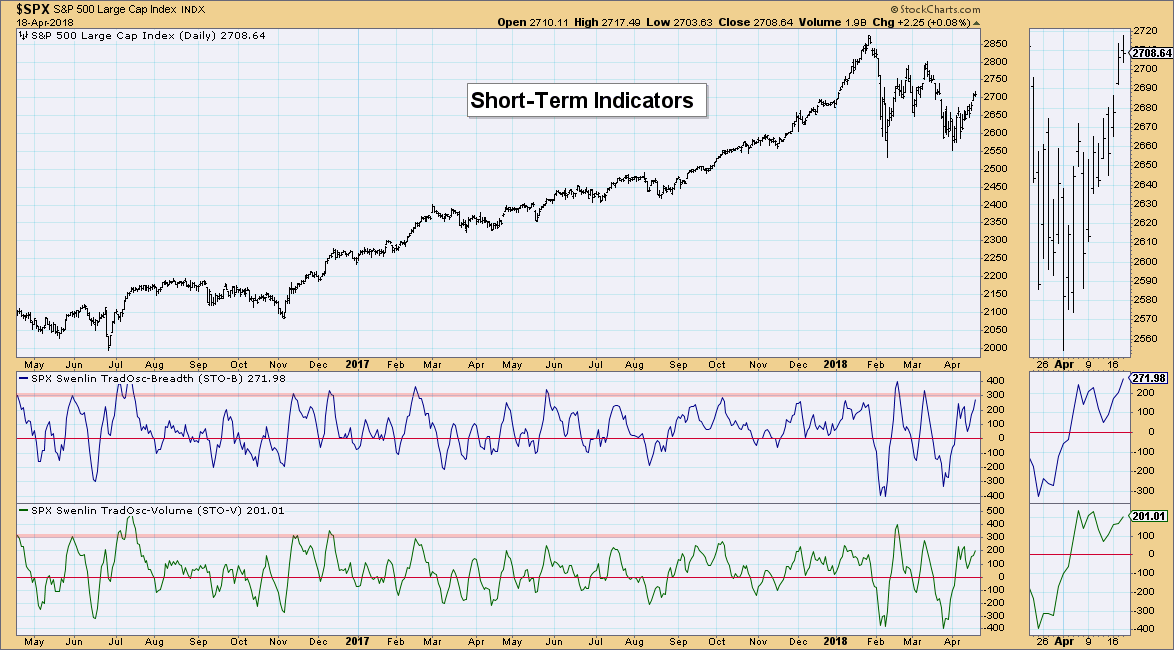
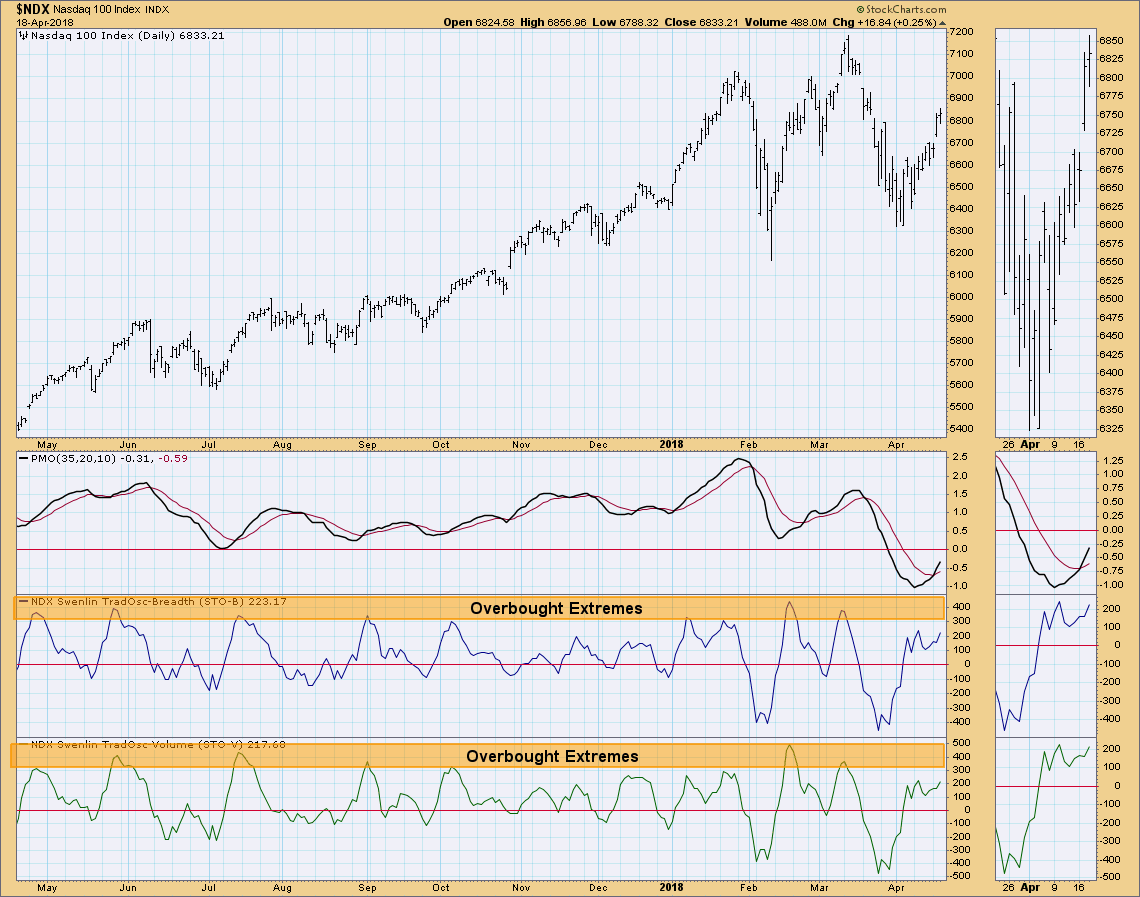
This is where concern lies. These indicators are now in very overbought territory. There is definitely still room for them to move higher and if you take a look at the same indicators for the NDX and Dow, you'll see that they aren't quite as overbought at the short-term SPX version of these indicators. This suggests that we could see more upside movement before a short-term decline asserts itself.
Intermediate-Term Indicators:
For the intermediate term, the ITBM has broken above declining tops resistance and the ITVM is on its way to a breakout.
Conclusion:
While short-term indicators are overbought, they still have some room to move higher should the market decide to continue the breakout. However, with the pullback during today's trading, the possible island setting up, volume moving lower and VIX puncture, we could see this rally over sooner than later. Good news is that for now, IT indicators are looking healthy and suggest any short-term decline will be just that, a "short"-term decline.
DOLLAR
IT Trend Model: SELL as of 12/21/2017
LT Trend Model: SELL as of 05/24/2017
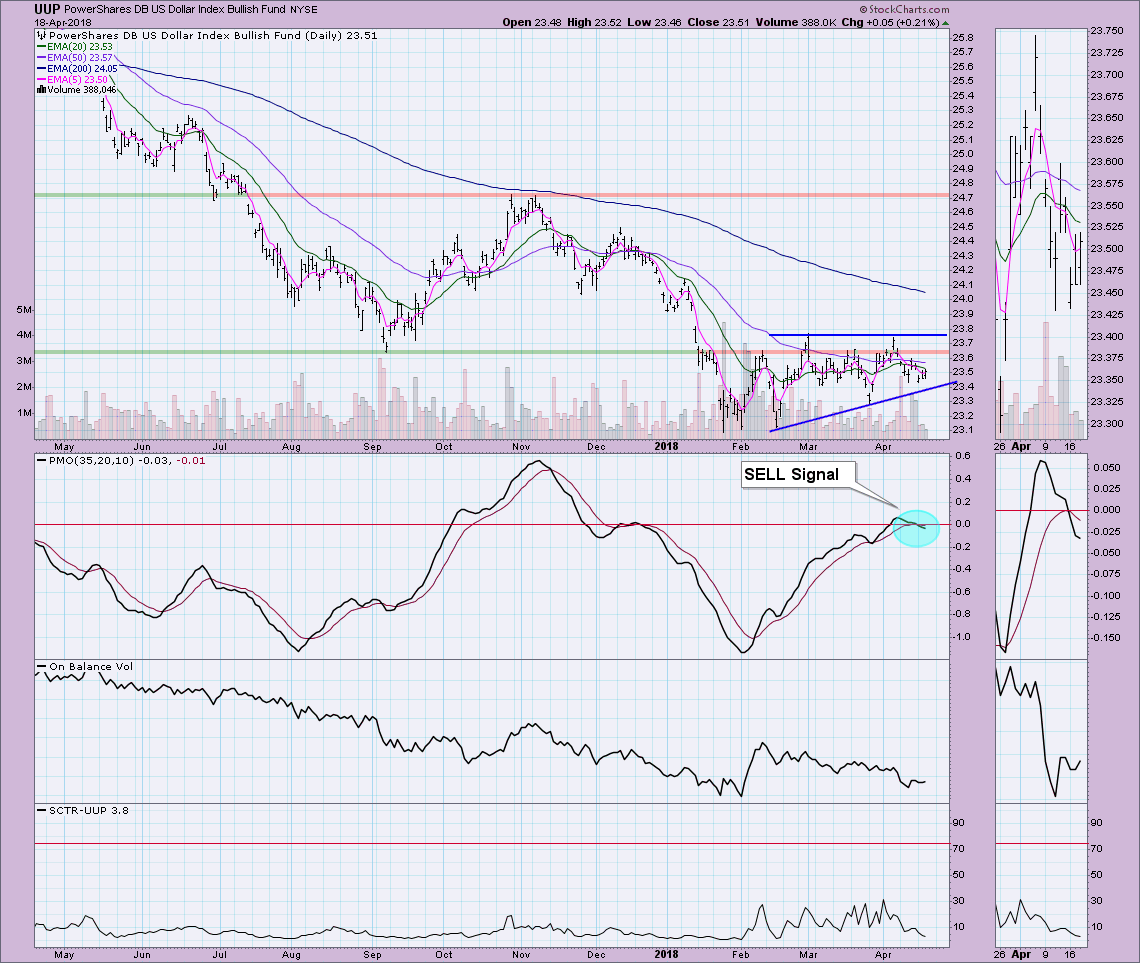
As noted in my title...will the Dollar EVER breakout!? I've only been looking for it since mid-February. UUP is certainly poised to finally breakout given the bullish ascending triangle. However, the PMO and 20/50-EMAs are not in agreement. A new PMO SELL signal and declining trends for the SCTR and OBV, don't inspire confidence. Yet, I'm still waiting on a breakout nonetheless. If the rising bottoms trendline doesn't hold, then I'll move bearish on the Dollar.
GOLD
IT Trend Model: BUY as of 1/2/2018
LT Trend Model: BUY as of 4/12/2017
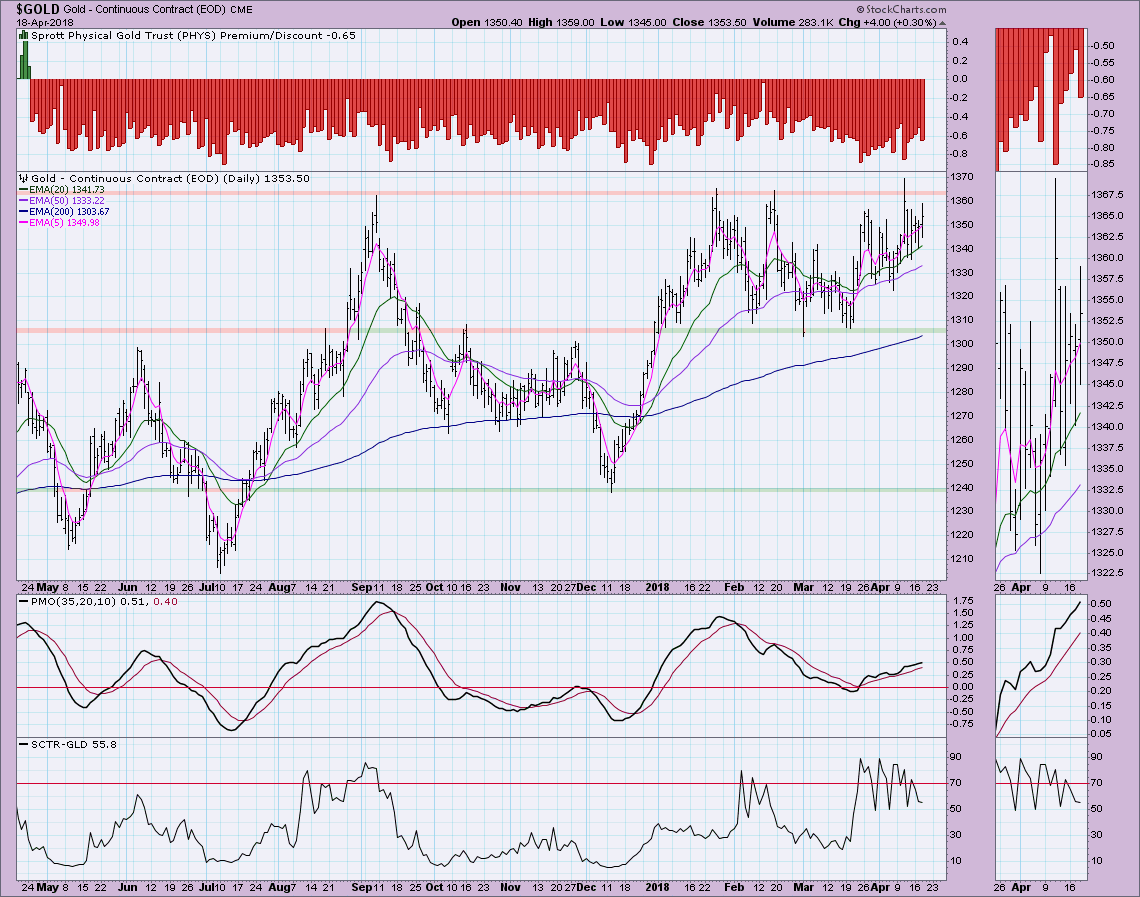
Given I'm bullish on the Dollar, I should be bearish Gold. Well, yes, I'm neutral to bullish on Gold. As with the Dollar, it's hard to argue with PMO signals, in this case a BUY signal and rising momentum. The SCTR is holding its own. Gold is in a trading range between 1305 and 1365. I'm not looking for a big breakout. I suspect it will pop above like we saw last week and then return quickly to the trading range.
CRUDE OIL (USO)
IT Trend Model: BUY as of 9/7/2017
LT Trend Model: BUY as of 11/2/2017
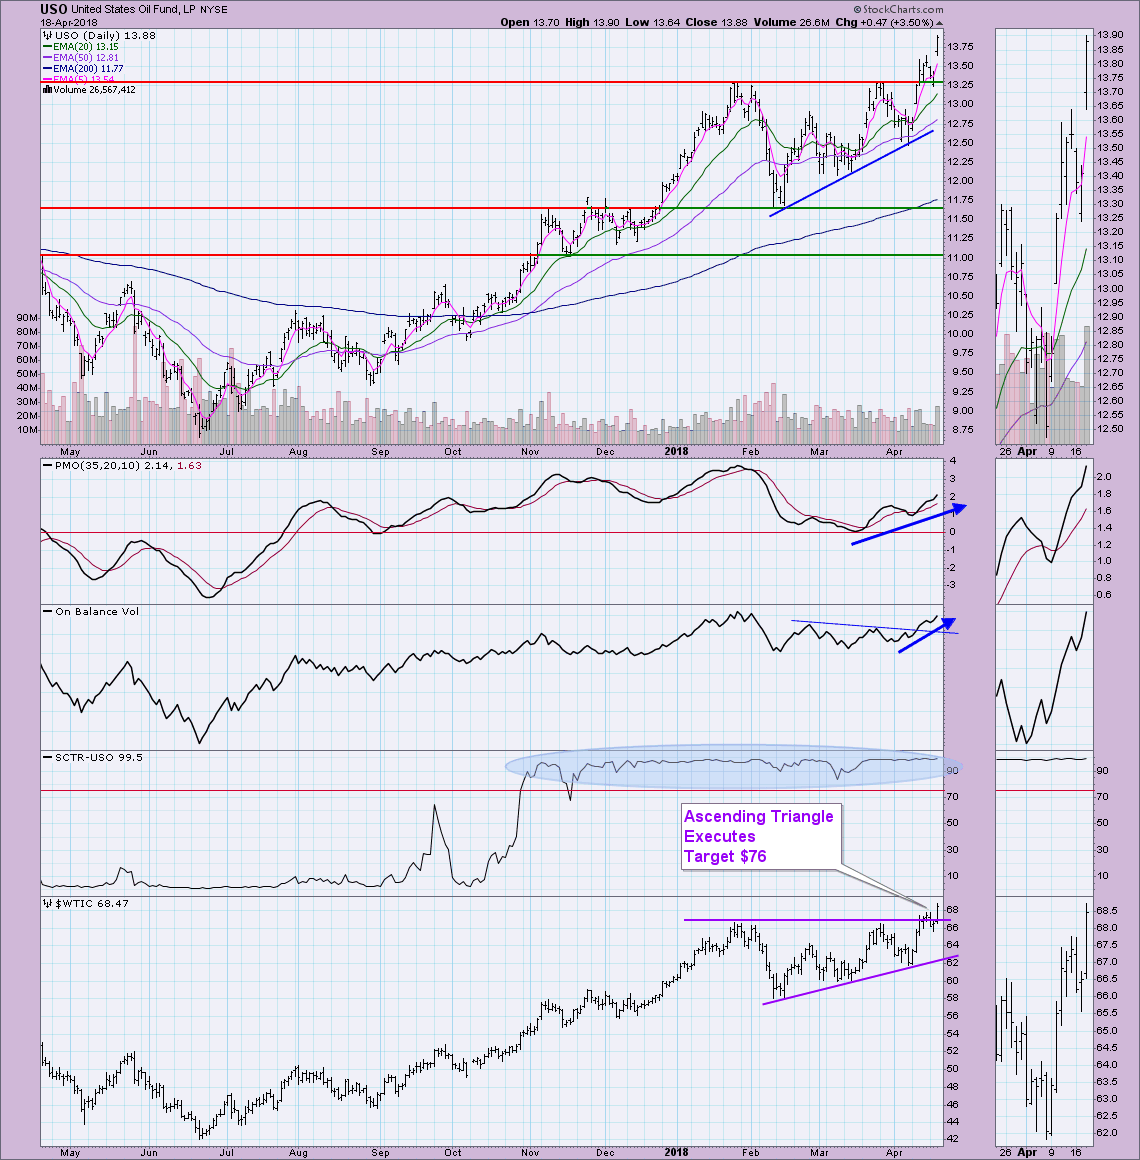
It appears we have a continuation gap coming off the breakout gap last week. US oil stores are being depleted and not fully restored which is causing oil prices to rise. $WTIC broke out from an ascending triangle. The target was calculated by taking the height of the triangle at the beginning of its formation. Adding $8 to the current top of the pattern gives us a target around $76. I'm looking for a continuation of this rally.
BONDS (TLT)
IT Trend Model: BUY as of 4/9/2018
LT Trend Model: SELL as of 2/8/2018
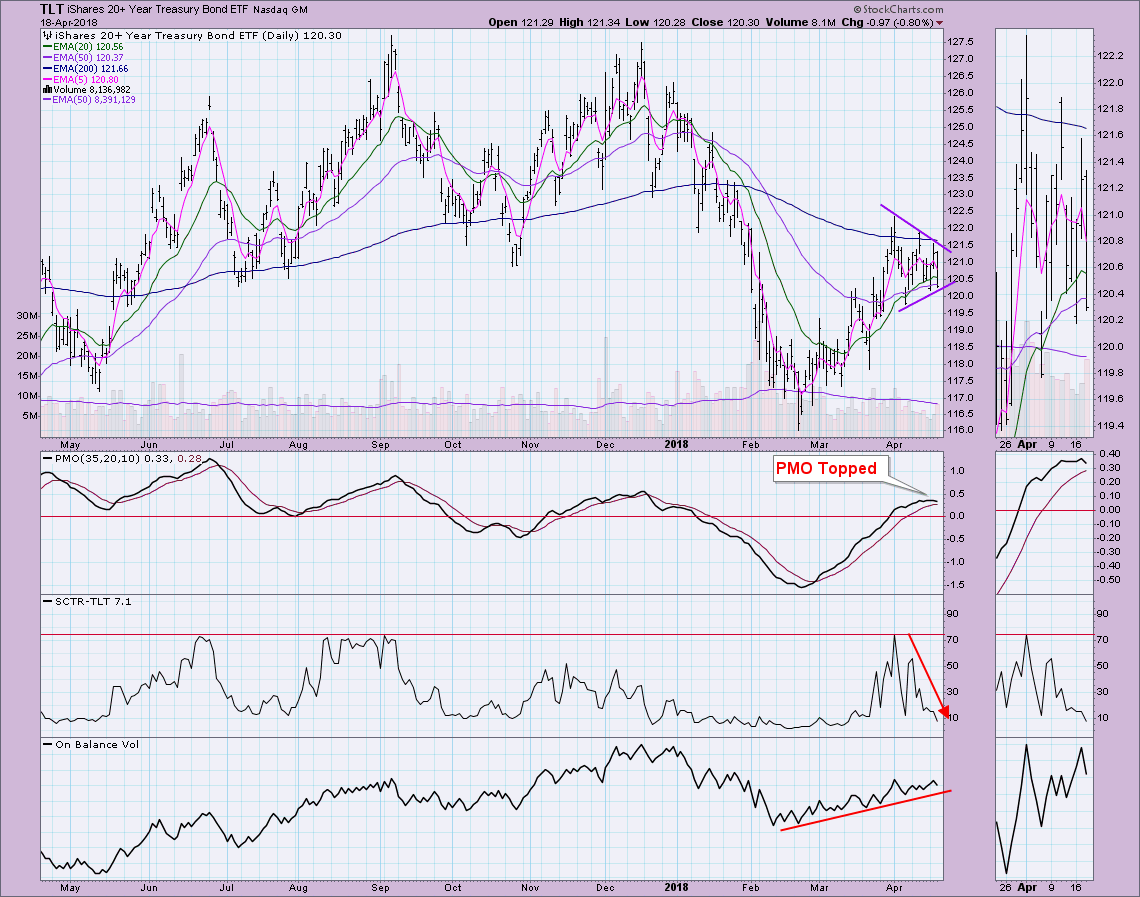
I took out the rising bottoms trendline drawn from the February low. It is still intact and hasn't been broken, but I wanted to concentrate on the newly formed symmetrical triangle. This is a continuation pattern. Unfortunately, the PMO and SCTR are not confirming a breakout here, it is suggesting a breakdown. The positive on the chart is the bullish confirmation of the OBV as its bottoms rise along with price bottoms. Given the mixed messages here, I'm going to lean bearish on Bonds. Price closed below the 50-EMA and we can see the most recent OBV top is lower than the previous at the beginning of April.
DecisionPoint Shared ChartList and DecisionPoint Chart Gallery
Price Momentum Oscillator (PMO)
Swenlin Trading Oscillators (STO-B and STO-V)
Technical Analysis is a windsock, not a crystal ball.
Happy Charting!
- Erin

