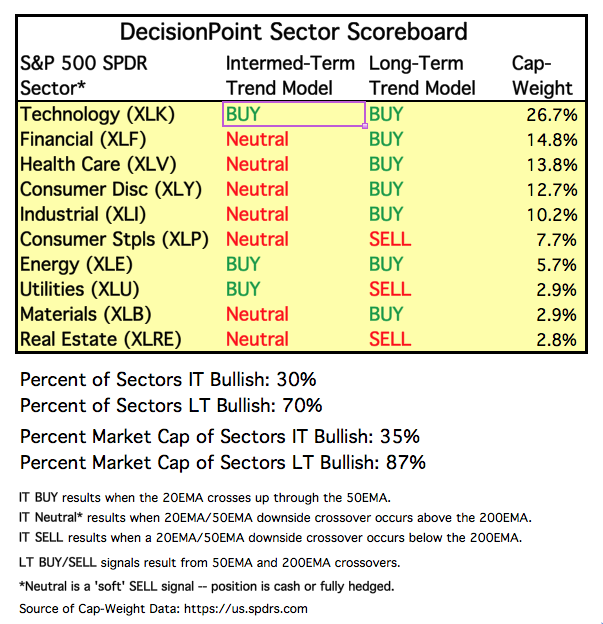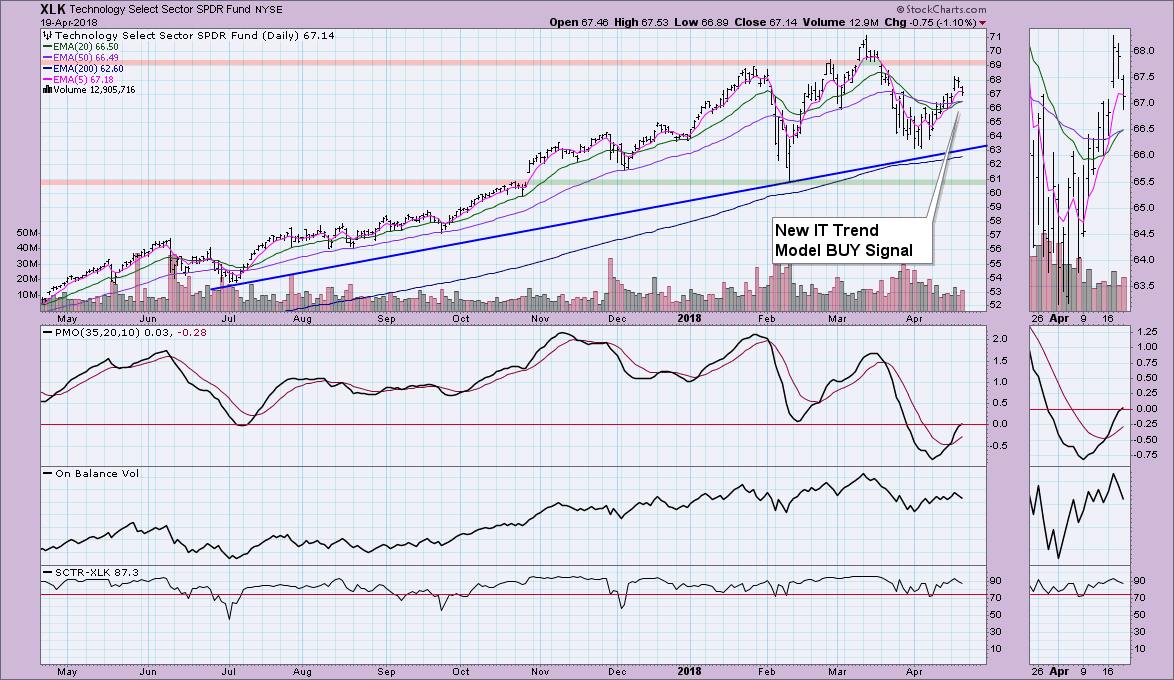
As noted in the DecisionPoint Sector Scoreboard, a new IT Trend Model BUY signal was added. Before this BUY signal, there were only two sectors on IT BUY signals and they were in somewhat defensive areas of the market, Utilities and Energy. It is good news to see this BUY signal back for the sector with the highest cap-weight and an aggressive area of the market. As I wrote yesterday, the market was short-term overbought and today's decline was likely the beginning of a small pullback. This new BUY signal suggests that the market should right itself in the intermediate term.

The daily chart shows that the small island formed by Tuesday/Wednesday trading was an island reversal as today the gap was closed. The IT Trend Model BUY signal was activated when the 20-EMA crossed above the 50-EMA. The margin is very thin between those two averages, but we won't get a whipsaw signal unless price closes below the 50-EMA. The chart is very bullish given the PMO is on a BUY signal and has now reached positive territory. The OBV is trending higher and the SCTR is strong.
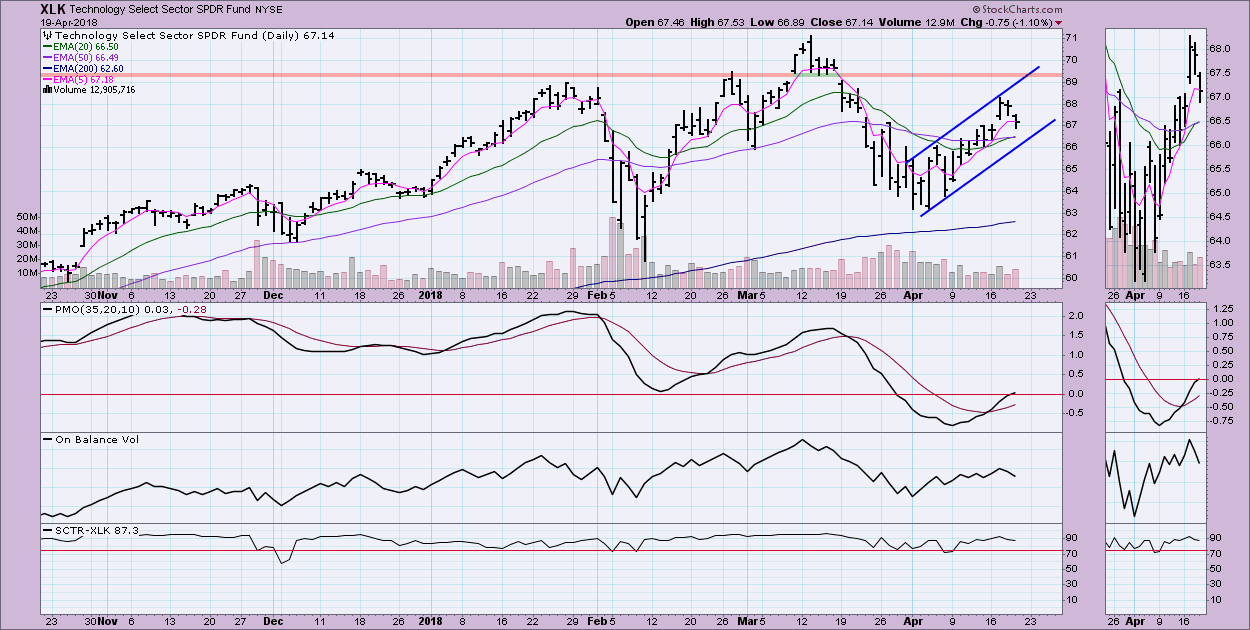
It was hard to tell in the daily one-year chart whether a rising wedge was forming, so I put together a six-month version. It's not a wedge, it's a rising trend channel. I am looking for a successful test of overhead resistance just above $69.
Helpful DecisionPoint Links:
DecisionPoint Shared ChartList and DecisionPoint Chart Gallery
Price Momentum Oscillator (PMO)
Swenlin Trading Oscillators (STO-B and STO-V)
Technical Analysis is a windsock, not a crystal ball.
Happy Charting!
- Erin
**Don't miss DecisionPoint Commentary! Add your email below to be notified of new updates"**


