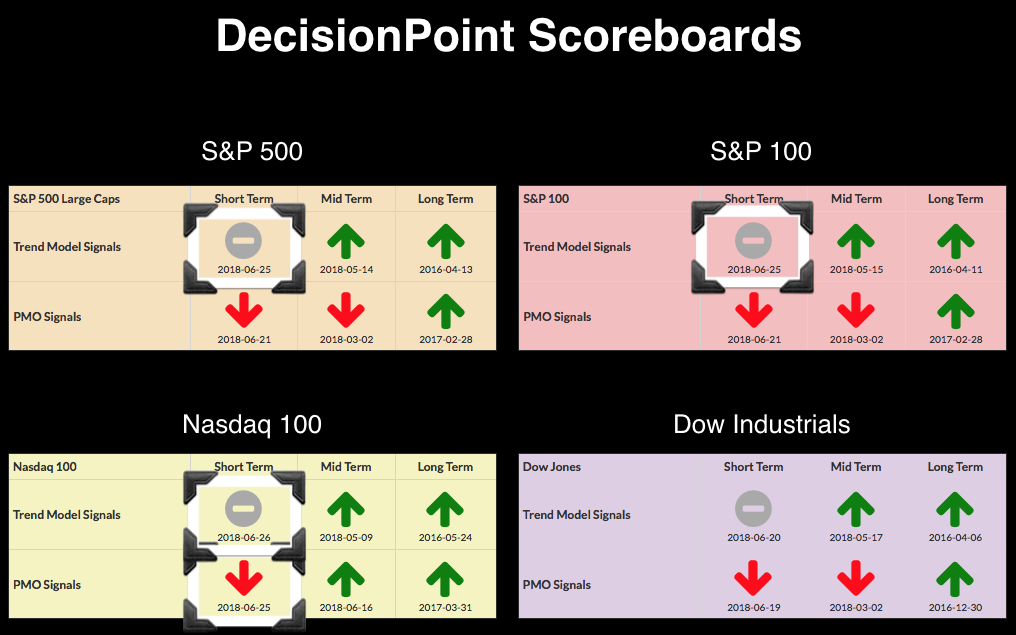
Today and yesterday saw four new signal changes on the DecisionPoint Scoreboards. The NDX has now joined in on short-term weakness in price trend and condition. Our short-term market indicators are starting to get oversold, but they continue in their downward trend. I came into this week expecting the SPX to close lower and I stand by it. Today we got a nice bounce, but it seems reactionary, not foretelling. These signal changes suggest there might be more decline ahead. But how low could they go?
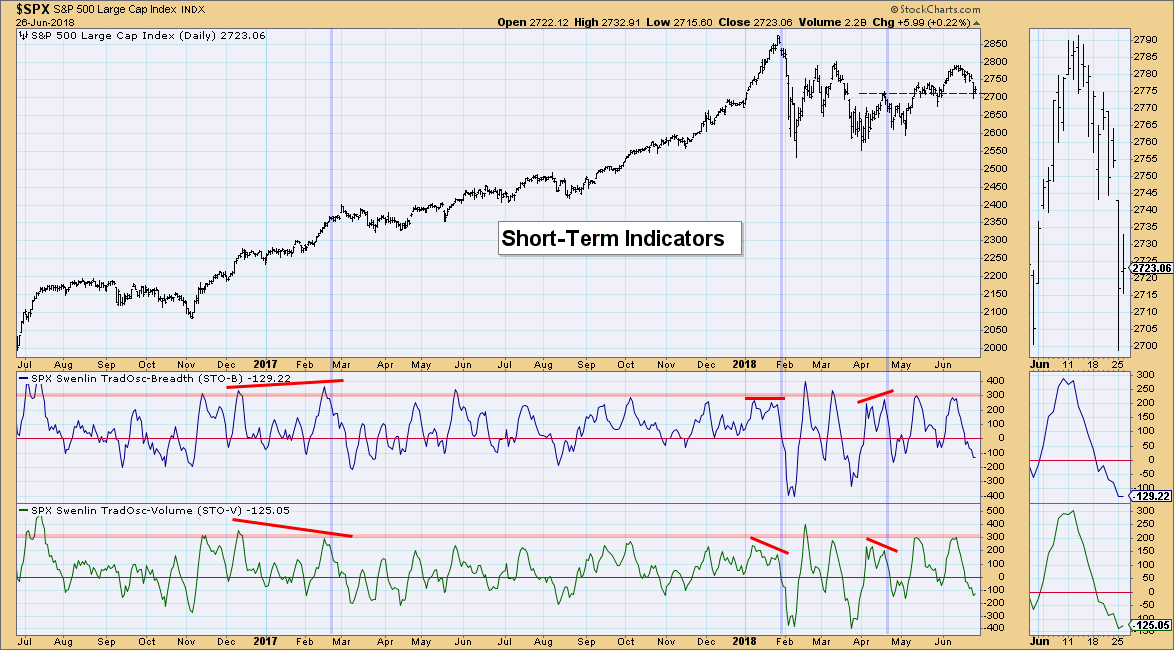
The Swenlin Trading Oscillators have been signaling market weakness since topping mid-June. Today's bounce managed to get them to stop declining on the day, but we could be looking at a 'tick' up like we did last week which was a head fake. I invite you to look at these same indicators for the NDX in the second chart. Note that we did not see a tick up.
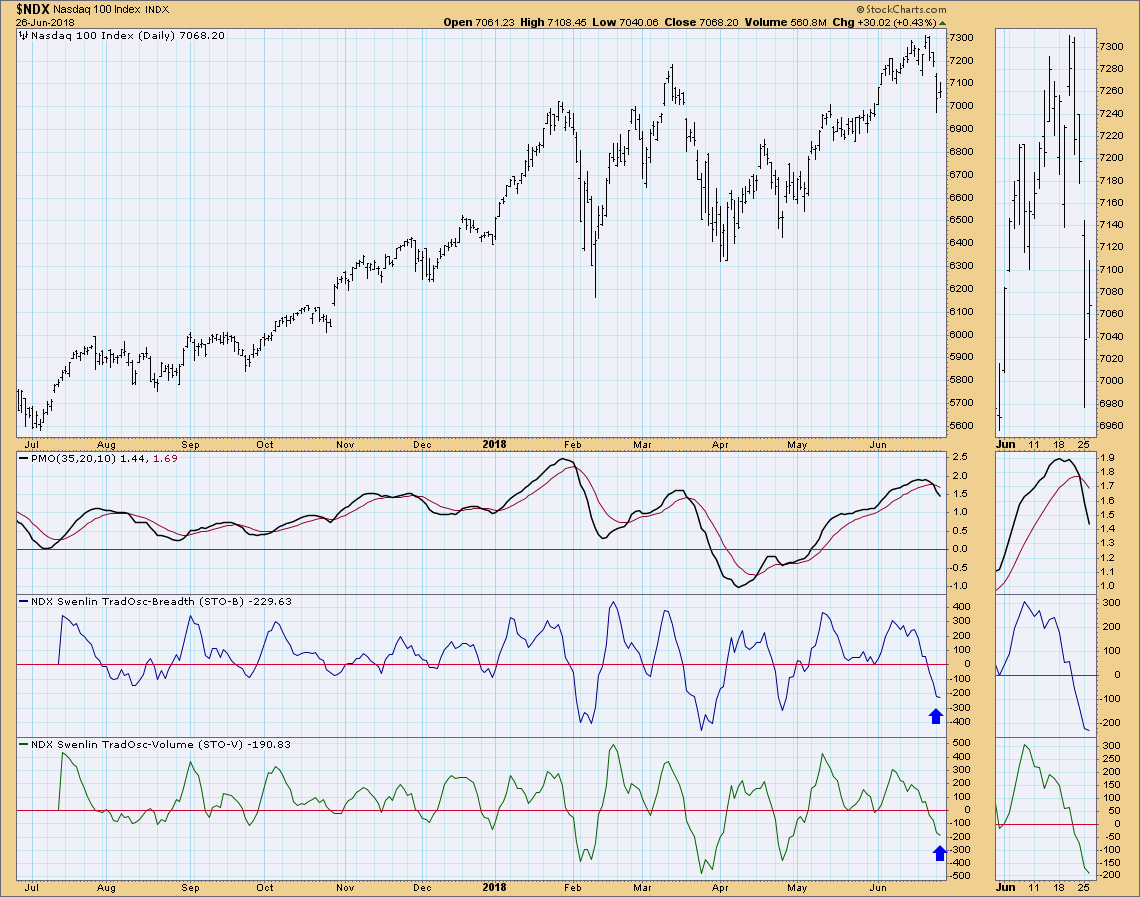
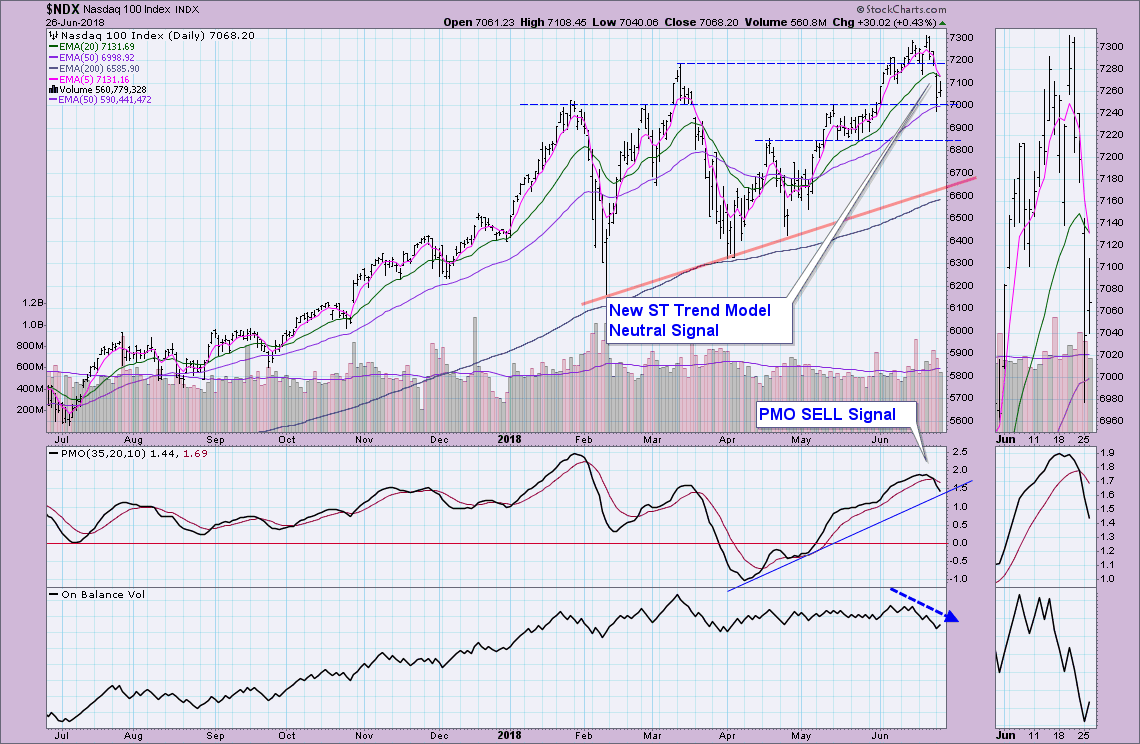
The NDX which had been posting new all-time highs last week, took a nose dive on Friday and particularly on Monday. Bad news would be the new Neutral STTM signal and the PMO SELL signal. On the possible bright side is that the gap created yesterday and today's OHLC bar could be forming an island reversal. The 50-EMA held up as support which is also a checkmark in the bullish column. The PMO is maintaining above the rising bottoms trendline, but if the other indexes are prescient, we will see this broken. The OBV is very bearish as volume is piling on to the downside. I suspect there will be more grinding across support at 7000 or worst case a test of support around 6850.
Both the OEX and SPX PMOs have broken below the rising bottoms trendline, effectively breaking the positive momentum trend. However, the OBV looks far healthier on both the OEX and SPX. You'll also notice that rising bottoms trendline support on both will likely coincide with horizontal support at the early March bottom.
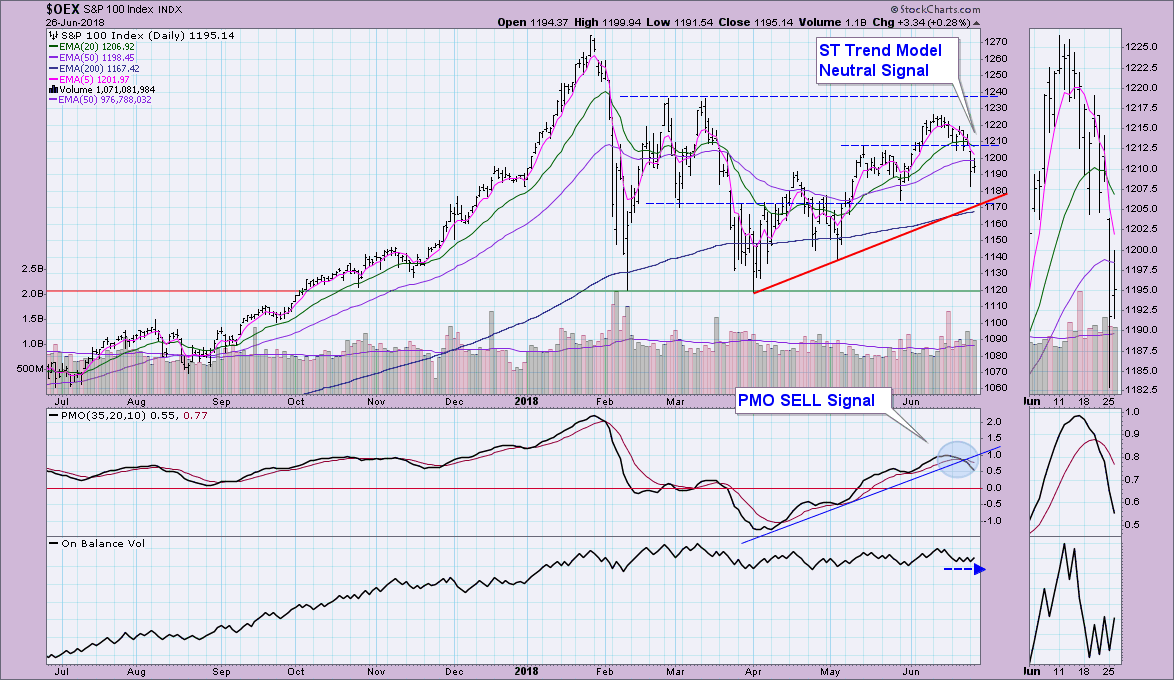
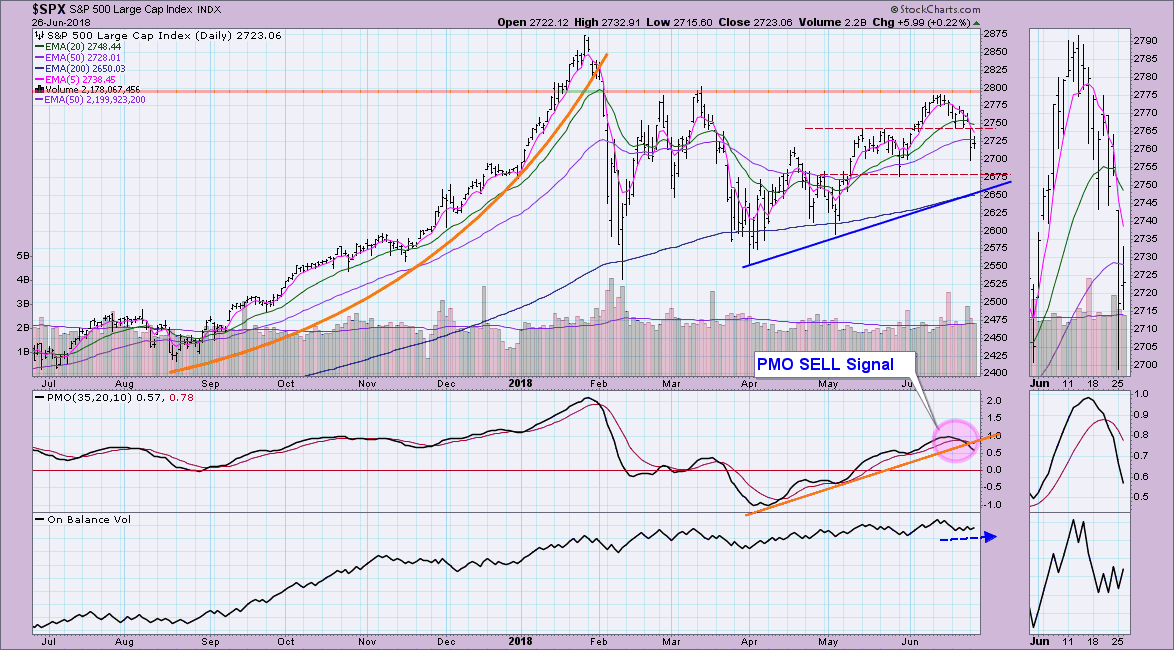
Conclusion: Short-term price trend and conditions are neutral to bearish. While the NDX has a more negative OBV, its PMO is still holding the rising trend. On the other hand, we have both the SPX and OEX PMOs breaking that rising trendline, yet both have bullish OBV trends. Given the Swenlin Trading Oscillators have not redirected in a meaningful way to the upside, I suspect weakness is still ahead with support for the NDX at 6850 - 7000, SPX at 2675 and OEX at 1170.
Technical Analysis is a windsock, not a crystal ball.
Happy Charting!
- Erin
Helpful DecisionPoint Links:
DecisionPoint Shared ChartList and DecisionPoint Chart Gallery
Price Momentum Oscillator (PMO)
Swenlin Trading Oscillators (STO-B and STO-V)
**Don't miss DecisionPoint Commentary! Add your email below to be notified of new updates"**


