

I've been running my "Momentum Sleepers" scan daily in the hopes of catching some stocks that are building momentum underneath the surface. These are mostly beat-down stocks, but volume and momentum are beginning to improve. I use a "speedy" Price Momentum Oscillator (PMO) and volume that is picking up speed.
Welcome to "DecisionPoint Daily Diamonds", a newsletter in which we highlight five "diamonds in the rough" taken from the results of one of my DecisionPoint scans. Remember, these are not recommendations to buy or sell, but simply stocks that I found interesting. The objective is to save you the work of the initial, tedious culling process, but you need to apply your own analysis and to see if these stocks pique your interest. There are no guaranteed winners here.
Current Market Conditions:
Based on current DecisionPoint analysis, the market is in an uptrend going by the DP Trend Models, which are all on BUY signals. The market is moderately overbought given the percentages on the Gold/Silver Cross Indexes and, based on that, the market is now flirting with all-time highs. The PMO is rising on a BUY signal and is not overbought.
It is important to consider the "odds" for success. Here are the current percentages on the Silver and Golden Cross Indexes, which are continuing to rise nicely:
Silver Cross: 64.6% SPX ITTM Buy Signals
Golden Cross: 64.4% SPX LTTM Buy Signals
Of the 11 results I got today from the Momentum Sleepers scan, I narrowed it down to these five:
Innovative Industrial Properties (IIPR):
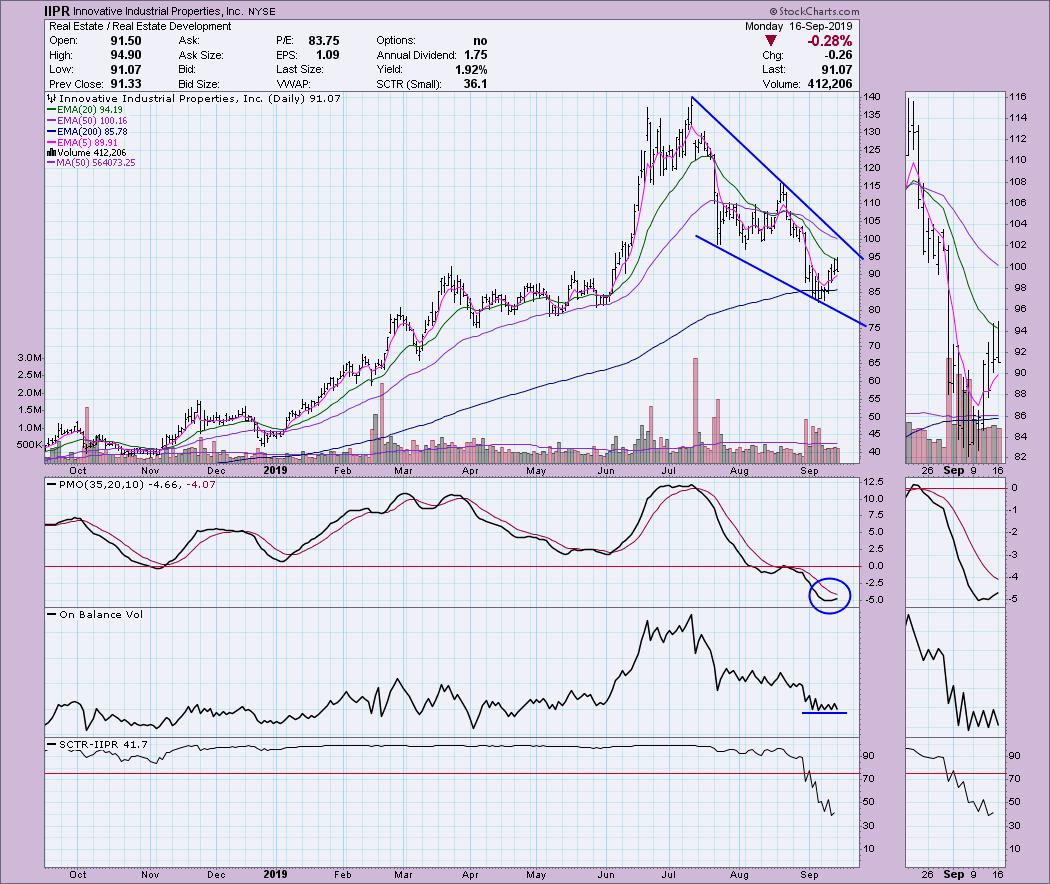
This chart has a bullish declining or falling wedge. These are bullish patterns. The PMO is turning up. I don't like that price twice failed to close above the 20-EMA and today closed near its low. The OBV has stopped its decline. The SCTR isn't optimum, but remember that these are considered "sleepers." You may not see obvious signs of awakening, but I like what is setting up.
SAGE Therapeutics Inc (SAGE):
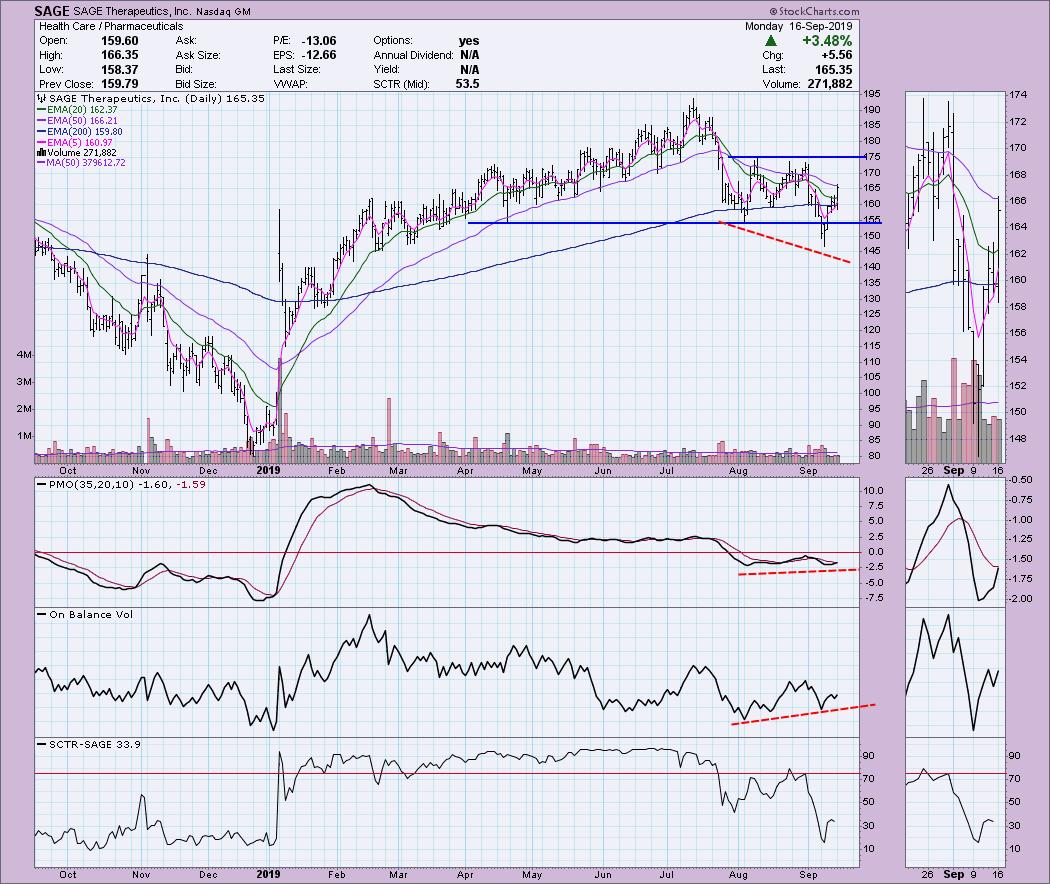
There's a lot to like with this chart. Probably the main detractor is today's giant leap forward, as it may require a pullback. Price shot above the 20-EMA and closed near its highs. Note the positive divergences on both the PMO and the OBV. I'm looking for at least a test at $175, but my target is $195.
TriNet Group Inc (TNET):
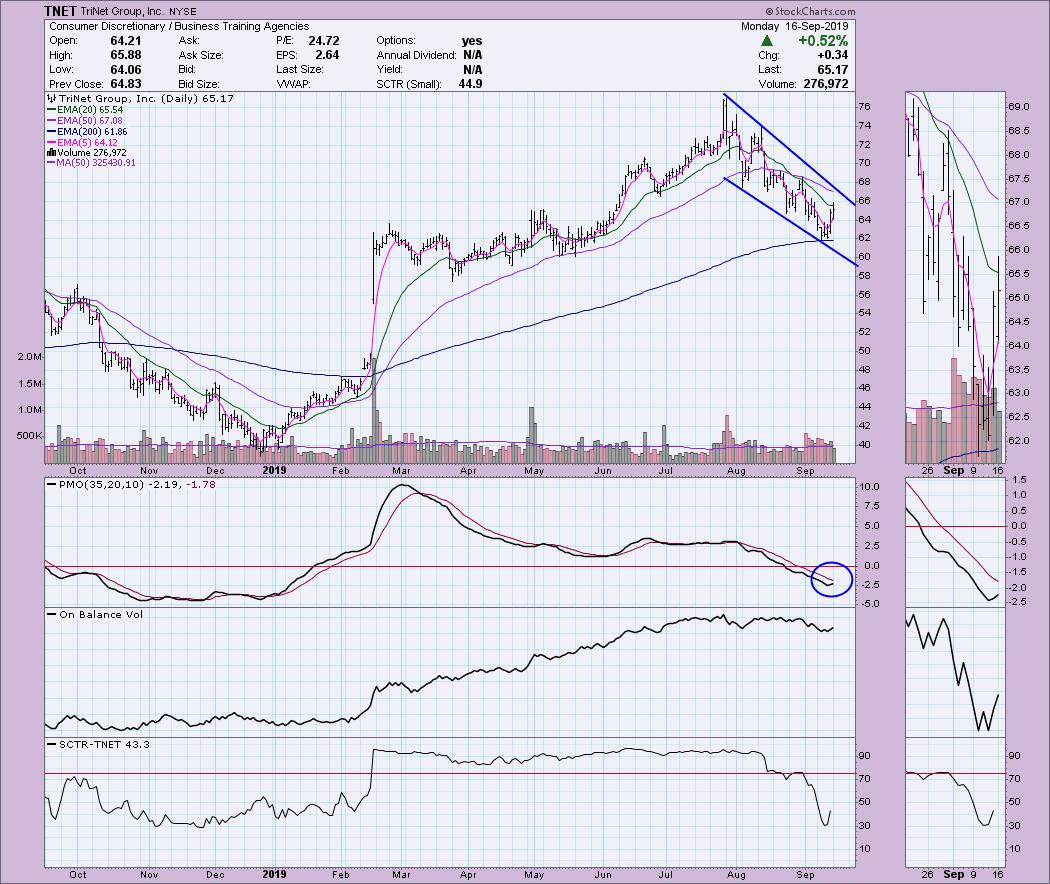
Here, we have another bullish falling wedge. The PMO has turned up in oversold territory. Price popped above the 20-EMA, but closed below it. Note in the thumbnail that, the last time price popped above the 20-EMA, it closed near its lows. Not this time. While it closed below the 20-EMA, the setup is better this time around. The PMO has turned higher in a definitive way and volume appears to be picking up. SCTR is coming back to life as well.
STAAR Surgical Co (STAA):
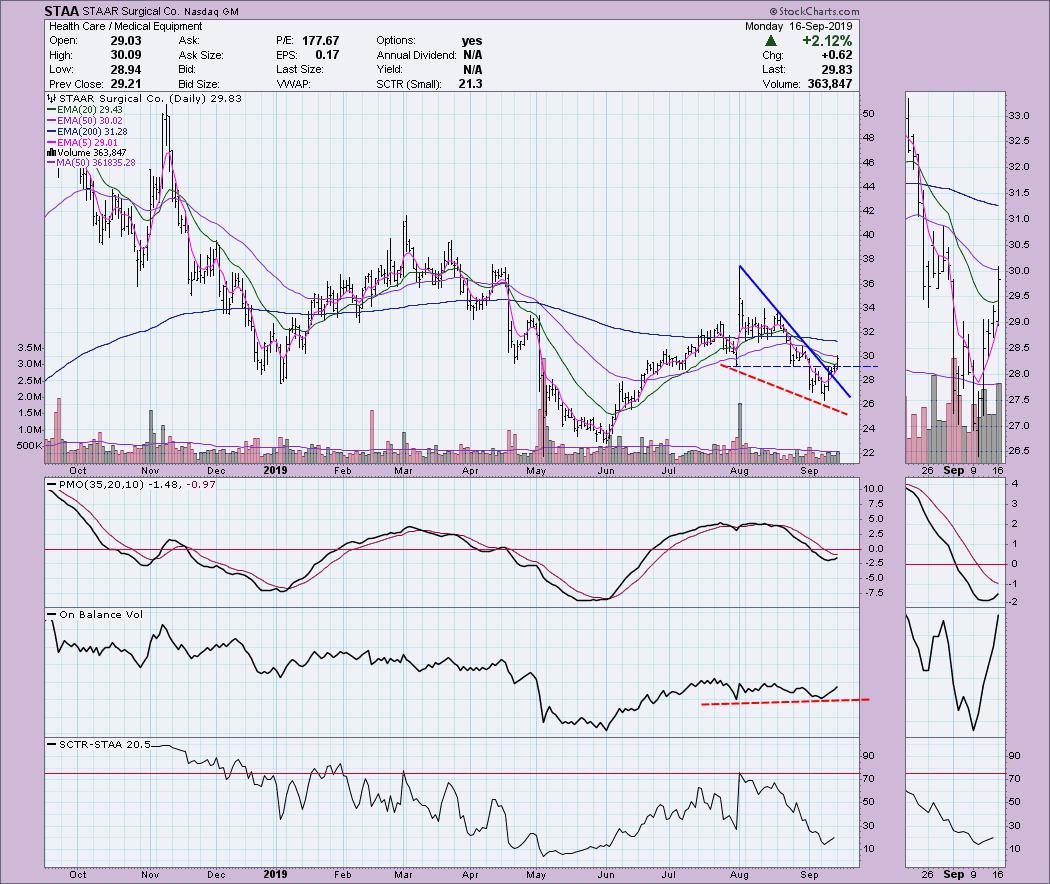
Here, we have a nice breakout from a declining tops trend line. Price closed above the 20-EMA for the first time since this decline began. The PMO is hooking up toward its signal line. We have a very positive divergence between price bottoms and OBV bottoms.
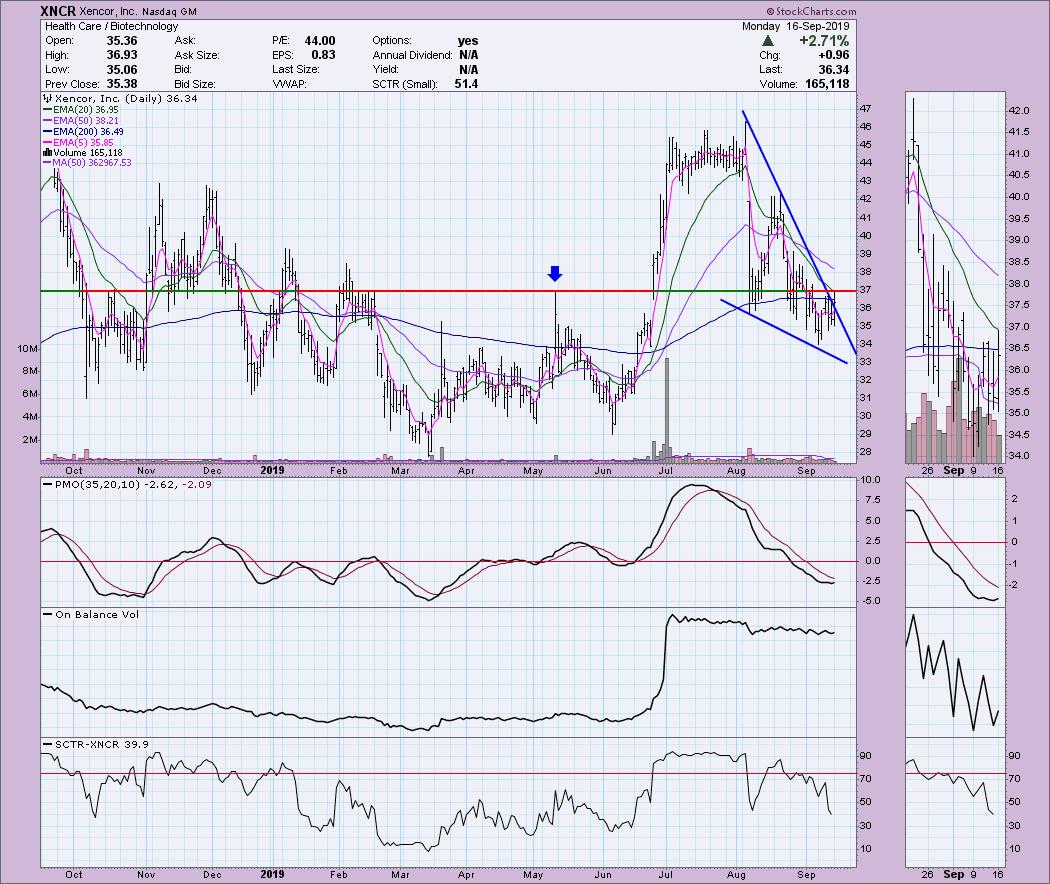
Xencor Inc (XNCR):
While this could be considered a falling wedge, the pattern is too mature. That may sound strange, but when price gets closer and closer to the apex of wedges and triangles, it will basically HAVE to resolve. The way it resolves isn't always meaningful. In this case, I believe that is somewhat true. A steep declining tops trend line begs to be broken. The fact that it didn't for over a month is concerning and tells you how "beat down" this stock is. I think it is interesting that the OBV didn't fall off a cliff during that time. This is positive and is what makes me look at this as a "momentum sleeper." I've annotated an arrow at the point I chose for overhead resistance. Currently, price hasn't made it above its 20-EMA, nor that price top. It's a biotech, so if you decide to ride it, I'd prepare myself for a lot of volatility. This one probably fits the description "diamond in the very rough."
Full Disclosure: I do not own any of the stocks above and I am not planning on purchasing any at this time. I'm currently about 60% in cash.
Watch the latest episode of DecisionPoint with Carl & Erin Swenlin LIVE on Mondays 5:00p EST or on the StockCharts TV YouTube channel here!
Technical Analysis is a windsock, not a crystal ball.
Happy Charting!
- Erin
erinh@stockcharts.com
NOTE: The stocks reported herein are from mechanical trading model scans that are based upon moving average relationships, momentum and volume. DecisionPoint analysis is then applied to get five selections from the scans. The selections given should prompt readers to do a chart review using their own analysis process. This letter is not a call for a specific action to buy, sell or short any of the stocks provided. There are NO sure things or guaranteed returns on the daily selection of "diamonds in the rough".
Helpful DecisionPoint Links:
DecisionPoint Shared ChartList and DecisionPoint Chart Gallery
Price Momentum Oscillator (PMO)
Swenlin Trading Oscillators (STO-B and STO-V)
**Don't miss DecisionPoint Commentary! Add your email below to be notified of new updates"**


