
Today, I ran a variety of scans, but the results are mostly from my "Bullish EMA - Mid-Range SCTR" scan, which nearly always gives me a lot of results. Today was no exception. I had 82 results! My other scans just weren't returning the set-ups I liked, but a few snuck in. When I looked at the names on the Diamond list today, I thought "yummy flowers"!
Welcome to the "DecisionPoint Daily Diamonds", a newsletter in which we highlight five "diamonds in the rough" taken from the results of one of my DecisionPoint scans. Remember, these are not recommendations to buy or sell, but simply stocks that I found interesting. The objective is to save you the work of the initial, tedious culling process, but you need to apply your own analysis to see if these stocks pique your interest. There are no guaranteed winners here.
Current Market Conditions:
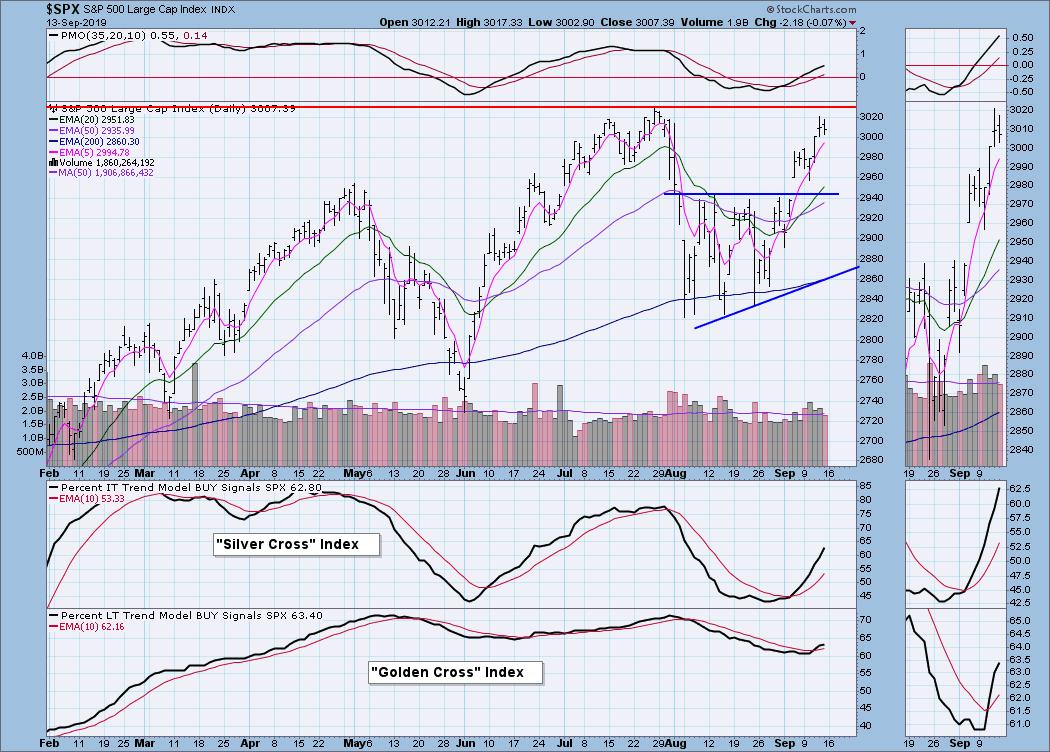
Based on current DecisionPoint analysis, the market is in an uptrend going by the DP Trend Models, which are all on BUY signals. The PMO is rising on a BUY signal and is not overbought. Conditions are bullish, with weekly sector leadership in the Financial (+3.83%), Energy (+3.47%), Materials (+3.32%) and Industrial (+2.78%) sectors and weekly sector weakness in the Real Estate sector (-3.04%) and Consumer Staples (-0.65%).
Here are the current percentages on the Silver and Golden Cross Indexes, which are continuing to rise nicely:
Silver Cross: 62.8% on ITTM Buy Signals
Golden Cross: 63.4% on LTTM Buy Signals
Of the 82 results I got today from the Bullish EMA - Mid-Range SCTR scan, I narrowed it down to these five:
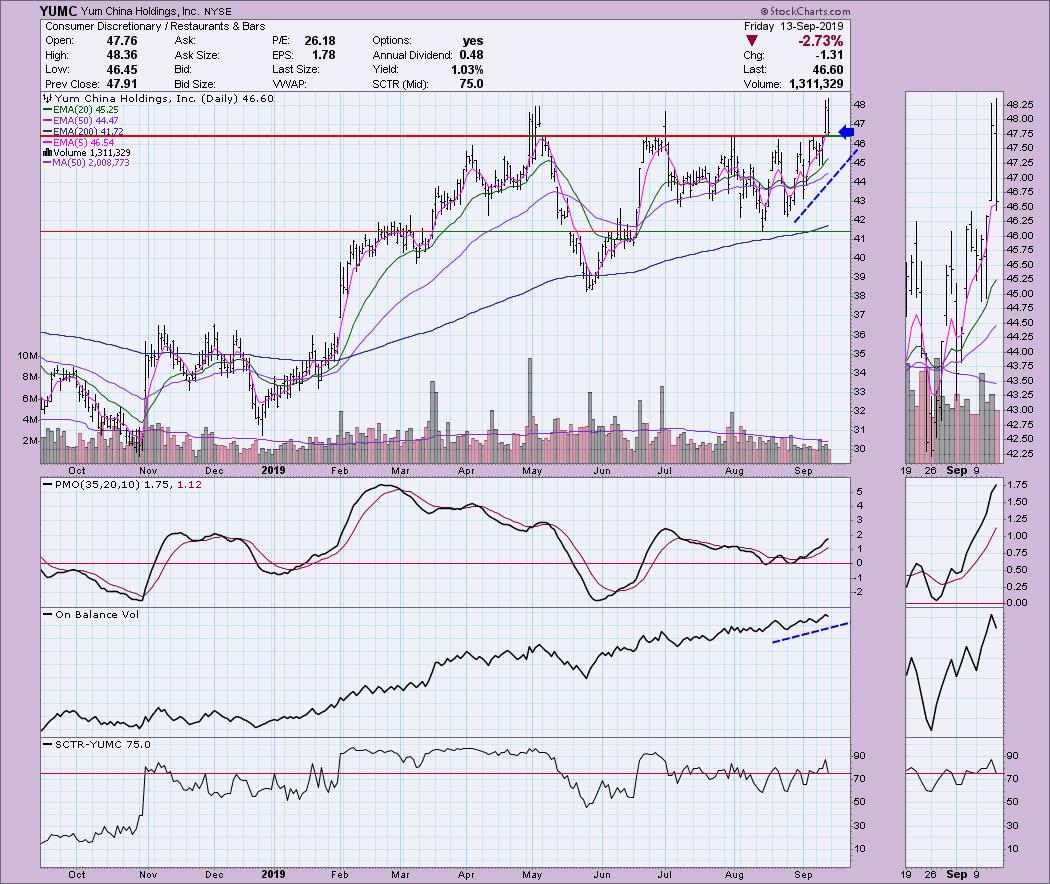
I think YUMC is certainly a "yummy" chart. This is what you want to see: a strong breakout to new intraday highs one day, followed by a pullback toward the breakout point over the next day or two. The PMO is rising and not overbought. OBV shows us that volume is continuing to come in (more accumulation than distribution).
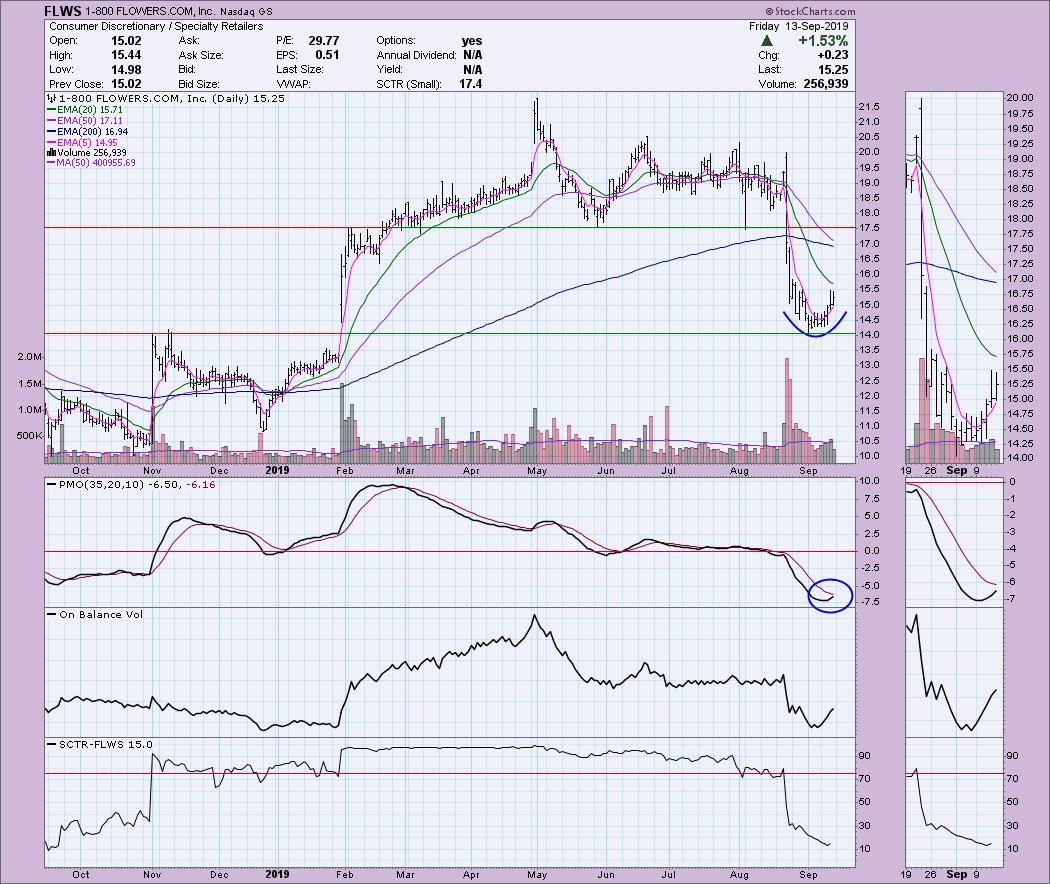
Smell the flowers! FLWS is a beat-down stock that looks like it is ready to make a move back to the previous breakdown point at $17.50. That's the next area of resistance. Note that the bottom came in right at the November top. The gap from late January was not covered before this rally, which I find bullish. Note the positive volume coming in this past week.
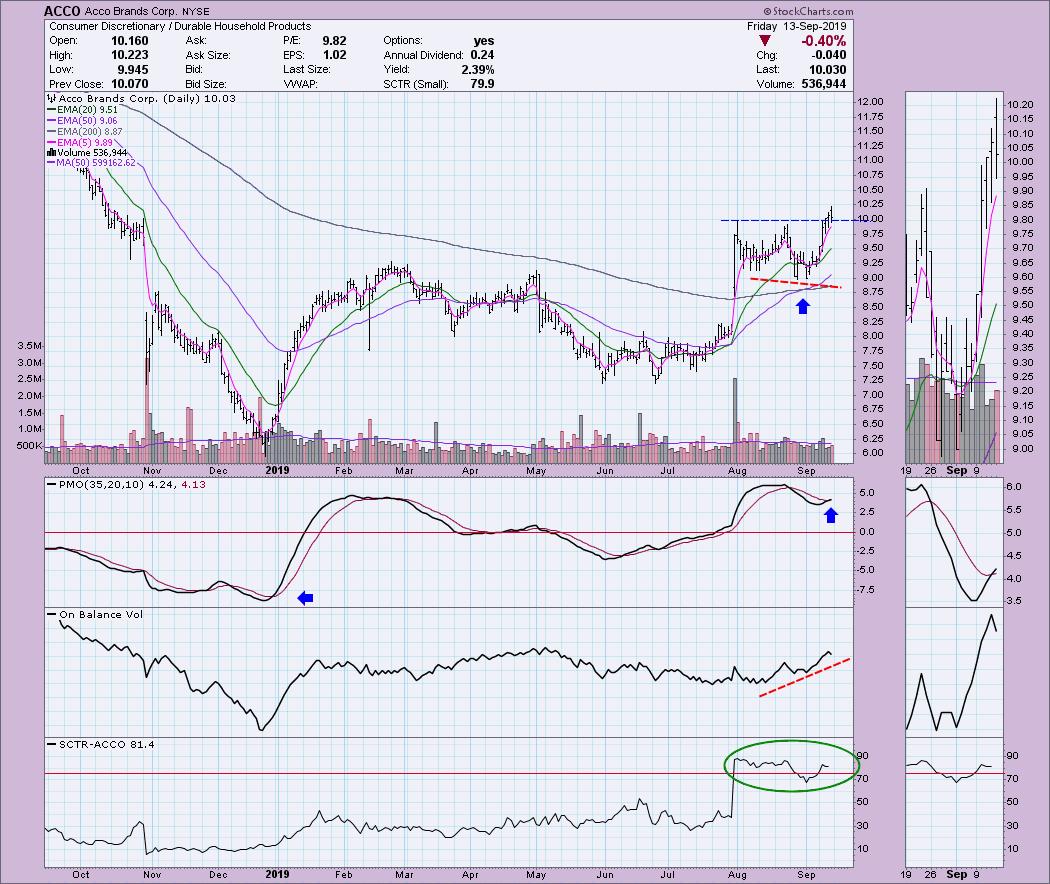
Acco Brands (ACCO) had a nice breakout yesterday and today was the pullback. The PMO seems a bit overbought on this latest BUY signal, but let's note that we've seen lows past -7.5. The PMO travels in a range and, based on this, we can see the PMO move much higher than 4.24, since the upside of the range is around 7. The SCTR has been healthy. You can make a case for a bullish flag formation. Note the positive divergence on the OBV that preceded this breakout and the great volume coming in on this recent rally.
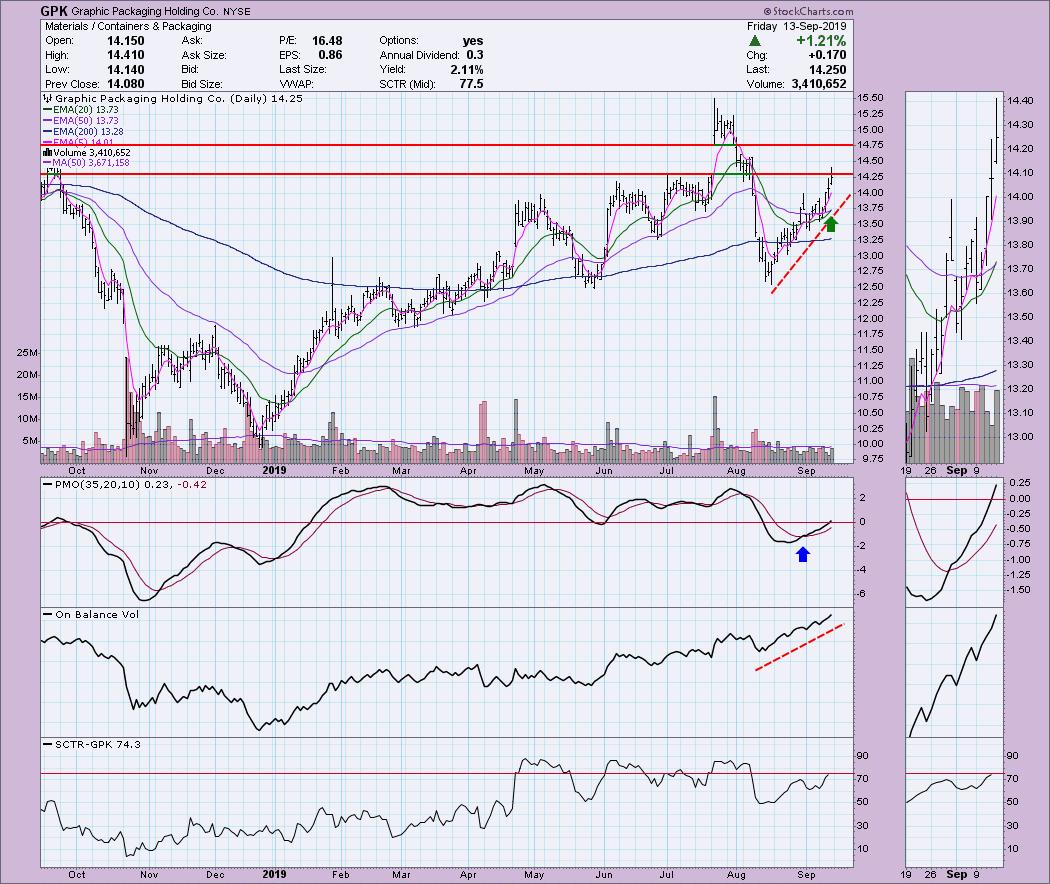
GPK has been a runner since mid-August, with incredible volume coming in while the stock is under accumulation. The 20-EMA just crossed above the 50-EMA, which triggered an IT Trend Model BUY signal. Today saw a tiny breakout above the highs in June. Don't make the mistake of taking the gap in July as an area of resistance or a gap to be covered with a rally. The gap was already covered on the way down, so it takes the significance away. Now, price could find the top of that gap as a problem, but I'd say it would be based on the price lows established at that level. The icing on this cake is the PMO, which is reaching above the zero line on a BUY signal.
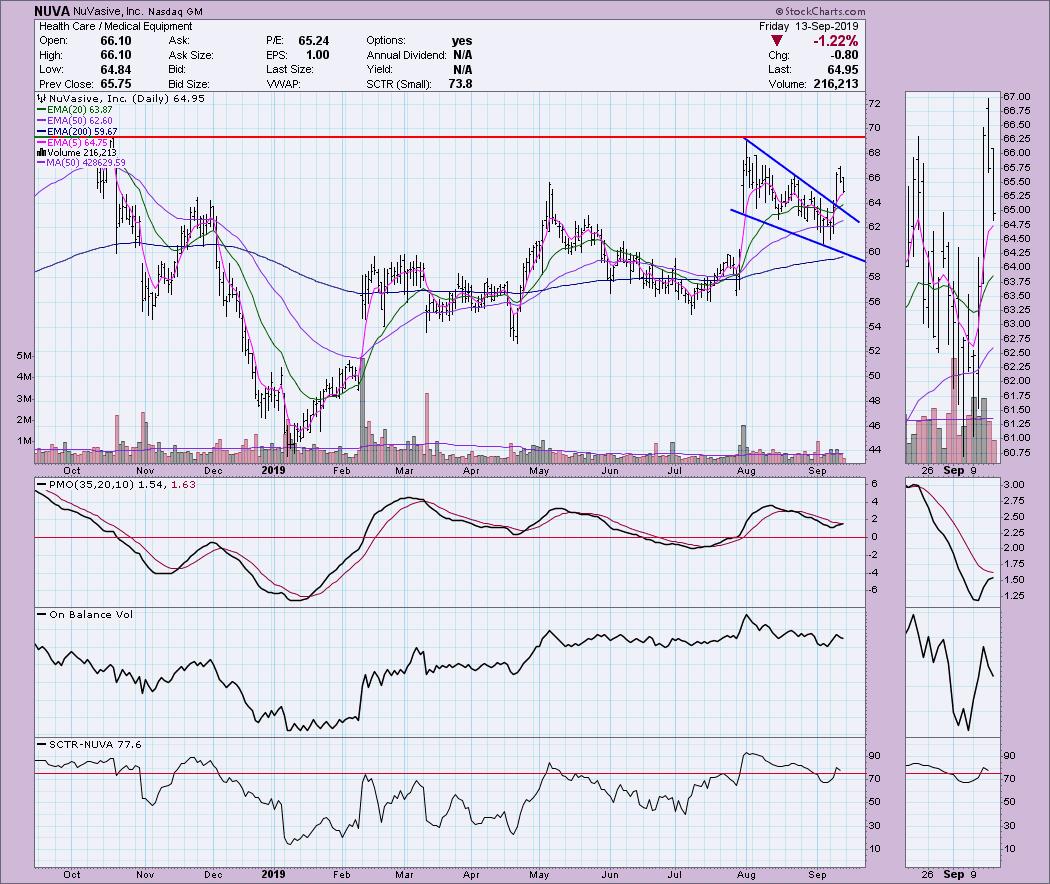
NUVA is another example of a breakout followed by a pullback. I always find these setups to be opportunities because we don't have to "chase" them. The stock is taking a breather, or pause, and that is what we want. This breakout came from a bullish wedge formation. My "back of the napkin" calculation for a minimum upside target is about $70, based on the length of the back of the pattern added to the breakout point. The PMO decelerated, but that was due to the pullback. Volume was much higher on the rally this week than on the decline that followed yesterday and today.
Full Disclosure: I do not own any of the stocks above and I am not planning on purchasing any at this time. I'm currently about 60% in cash, so I will be considering new longs likely next week.
Watch the latest episode of DecisionPoint with Carl & Erin Swenlin LIVE on Mondays 5:00p EST or on the StockCharts TV YouTube channel here!
Technical Analysis is a windsock, not a crystal ball.
Happy Charting!
- Erin
erinh@stockcharts.com
NOTE: The stocks reported herein are from mechanical trading model scans that are based upon moving average relationships, momentum and volume. DecisionPoint analysis is then applied to get five selections from the scans. The selections given should prompt readers to do a chart review using their own analysis process. This letter is not a call for a specific action to buy, sell or short any of the stocks provided. There are NO sure things or guaranteed returns on the daily selection of "diamonds in the rough."
Helpful DecisionPoint Links:
DecisionPoint Shared ChartList and DecisionPoint Chart Gallery
Price Momentum Oscillator (PMO)
Swenlin Trading Oscillators (STO-B and STO-V)
**Don't miss DecisionPoint Commentary! Add your email below to be notified of new updates"**


