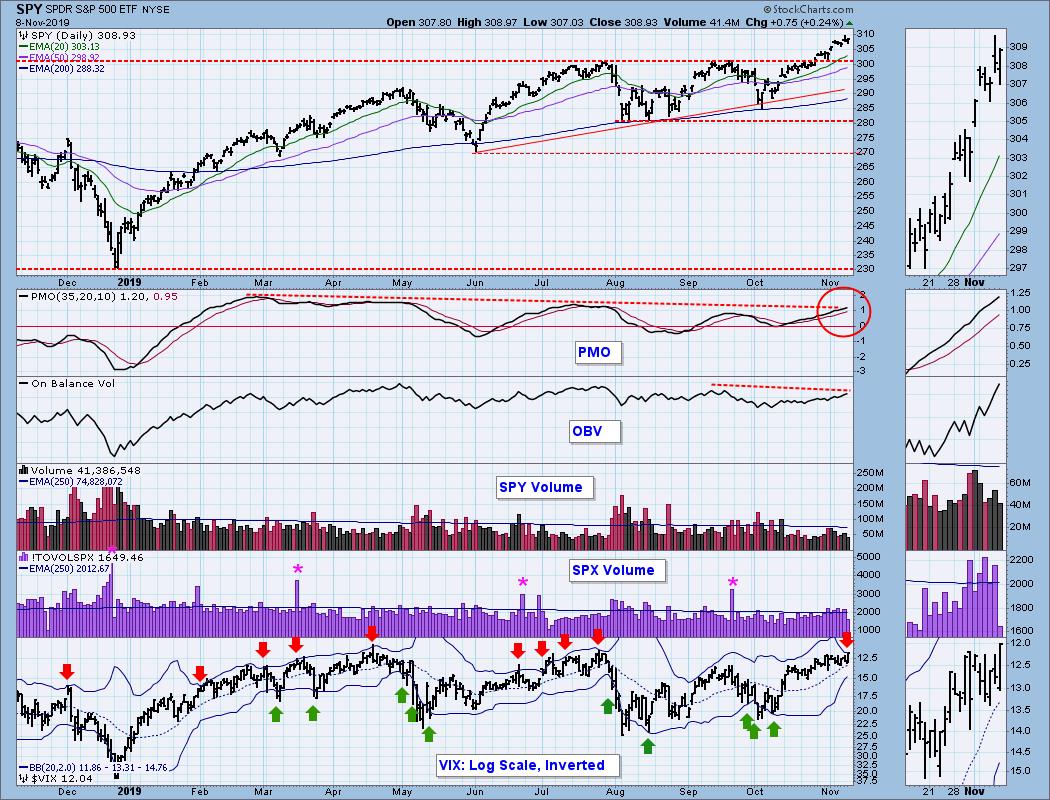
These are not huge problems, but they do have negative implications for the short term. First, there is the rising wedge formation, a formation that will most often resolve to the downside -- not always, but most often. Next the VIX is very close to the upper Bollinger Band, which means that SPY is short-term overbought. Finally, SPX Total Volume on Friday was only 82% of the one-year average. A reasonable expectation would be for price to pull back toward the resistance line, now support, that it broke through last week.
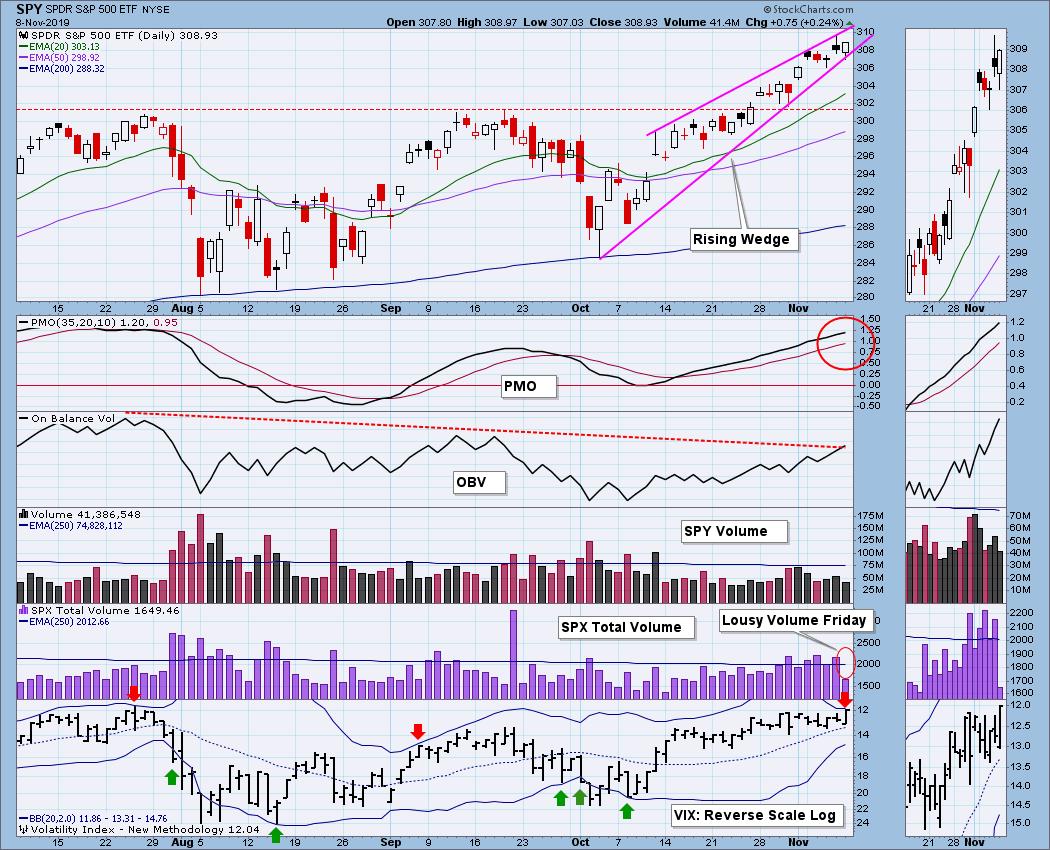
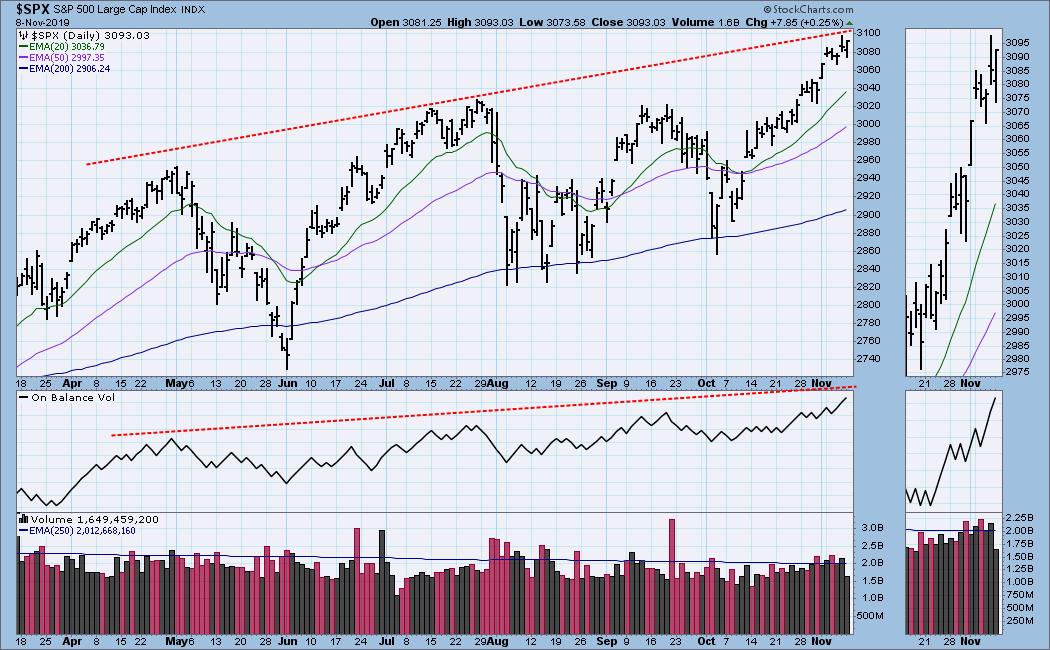
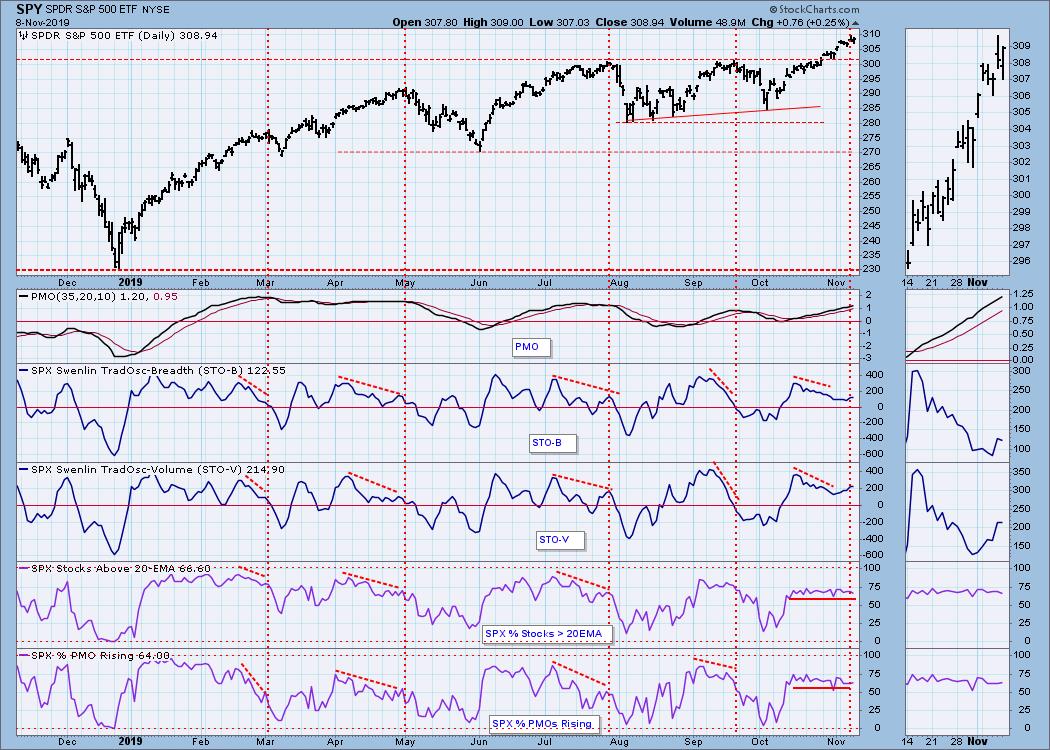
You may ask about the OBV negative divergence on the SPY chart -- lower OBV tops versus higher price tops -- which shows that volume behind the advance is fading. I prefer to use the actual S&P 500 chart where volume is concerned, because the ETF (SPY) volume reflects traffic for the ETF, not the S&P 500 Index, which we can see below actually confirms the rising price tops.
The DecisionPoint Weekly Wrap presents an end-of-week assessment of the trend and condition of the stock market (S&P 500), the U.S. Dollar, Gold, Crude Oil, and Bonds.
Watch the latest episode of DecisionPoint on StockCharts TV's YouTube channel here!
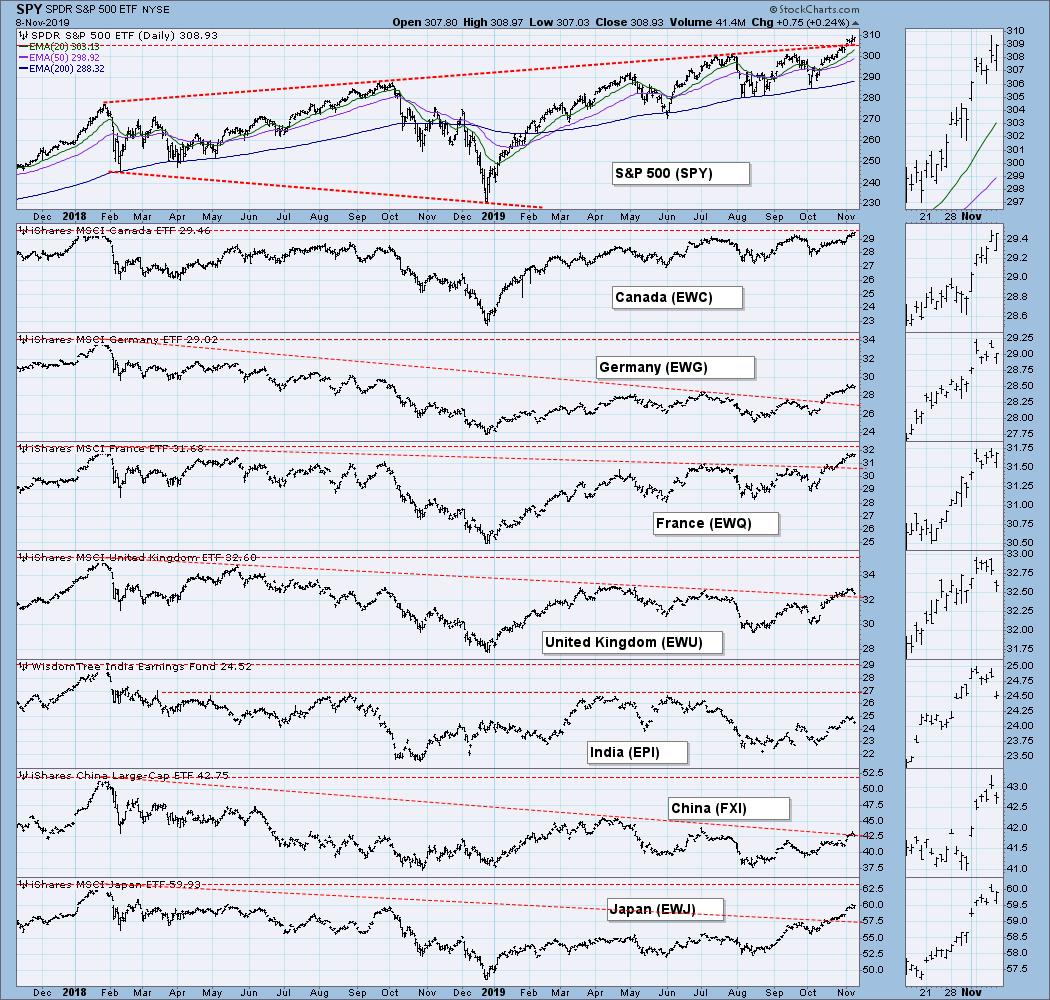
GLOBAL MARKETS
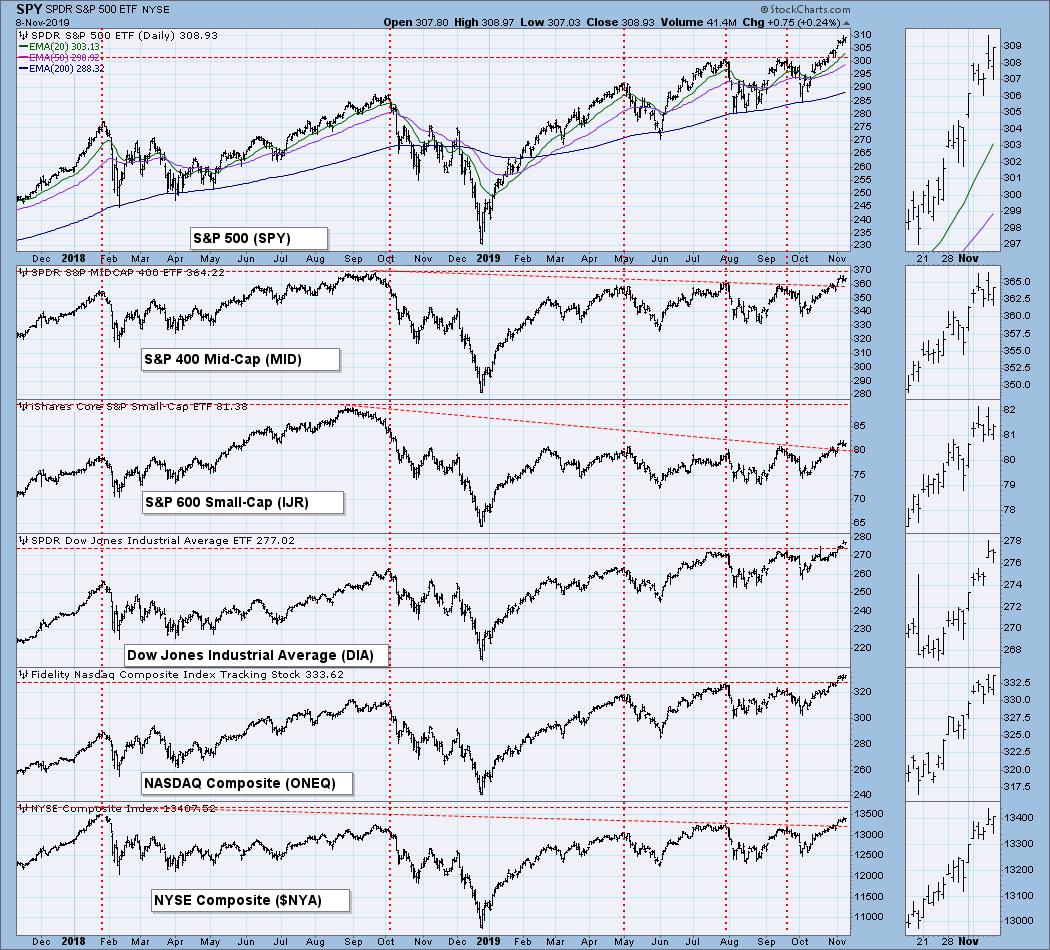
BROAD MARKET INDEXES
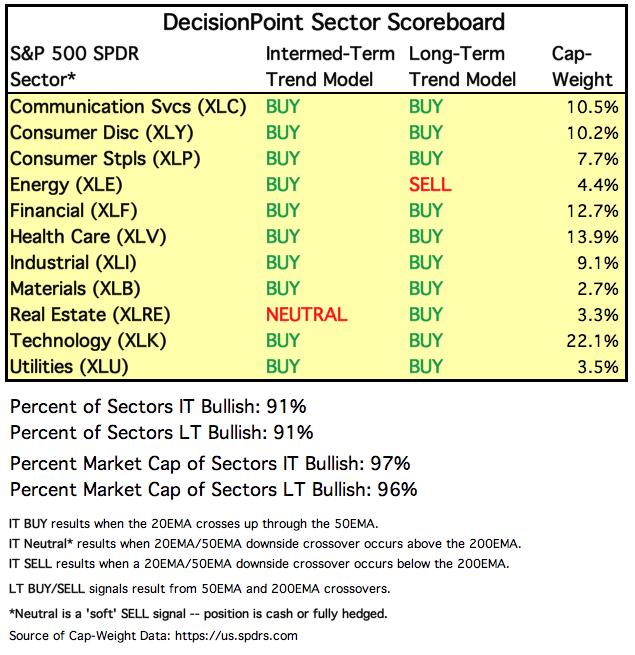
SECTORS
Each S&P 500 Index component stock is assigned to one, and only one, of 11 major sectors. This is a snapshot of the Intermediate-Term and Long-Term Trend Model signal status for those sectors.
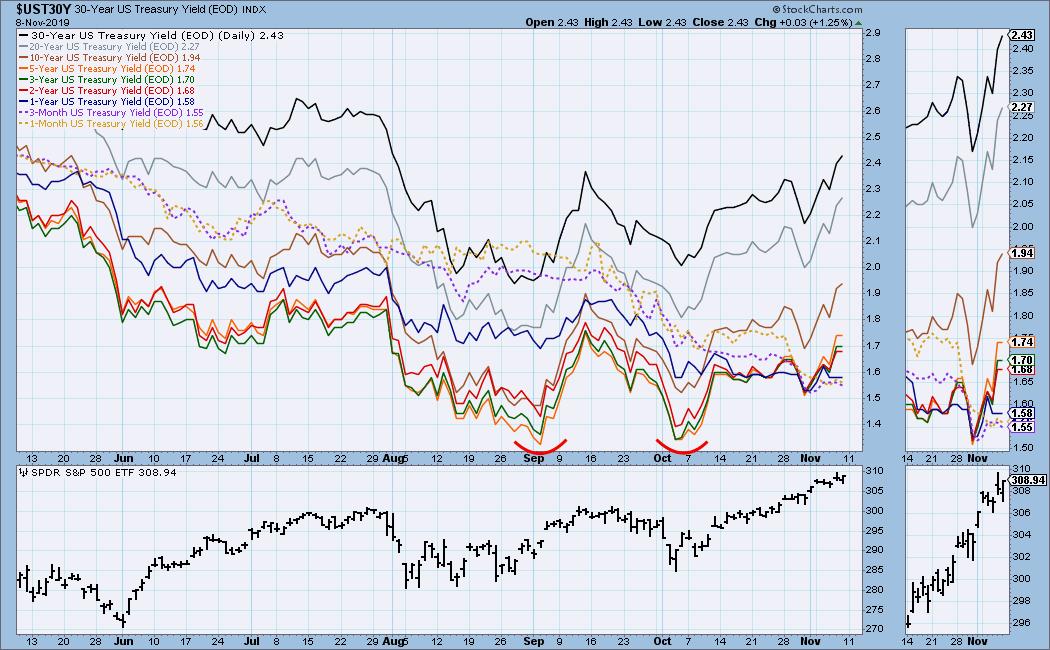
INTEREST RATES
This chart is included so we can monitor rate inversions. In normal circumstances the longer money is borrowed the higher the interest rate that must be paid. When rates are inverted, the reverse is true. Currently, yields are in a rising trend, having moved off of a double bottom.
STOCKS
IT Trend Model: BUY as of 9/6/2019
LT Trend Model: BUY as of 2/26/2019
SPY Daily Chart: My opening comments pretty well cover this chart.
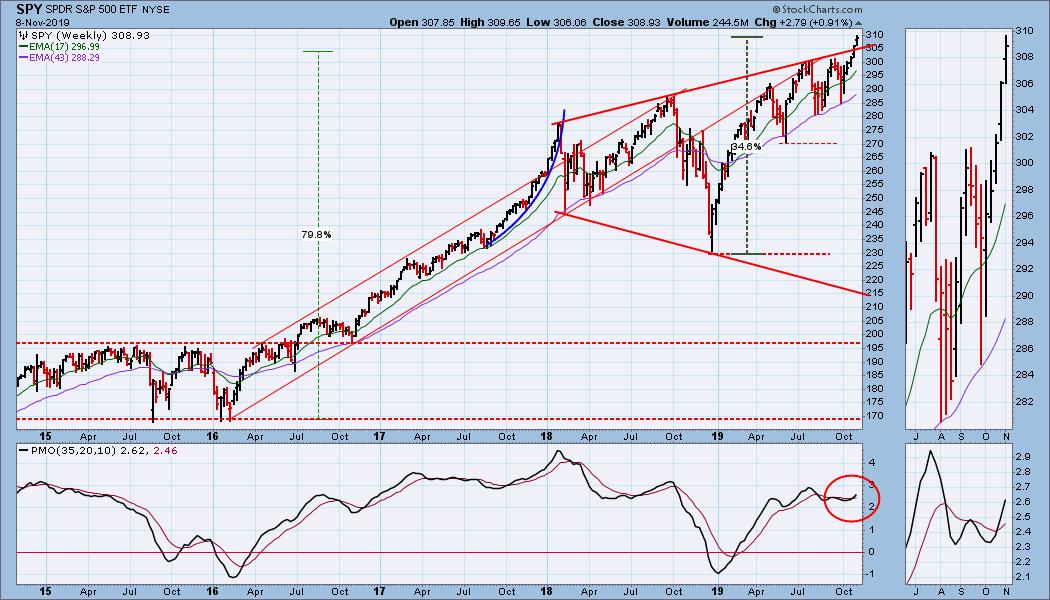
SPY Weekly Chart: The vertical up move of the last several weeks is beginning to resemble a parabolic, and that is a dangerous configuration.
Climactic Market Indicators: This week there was some follow through on last Friday's climactic pop, but there were no climax events this week.
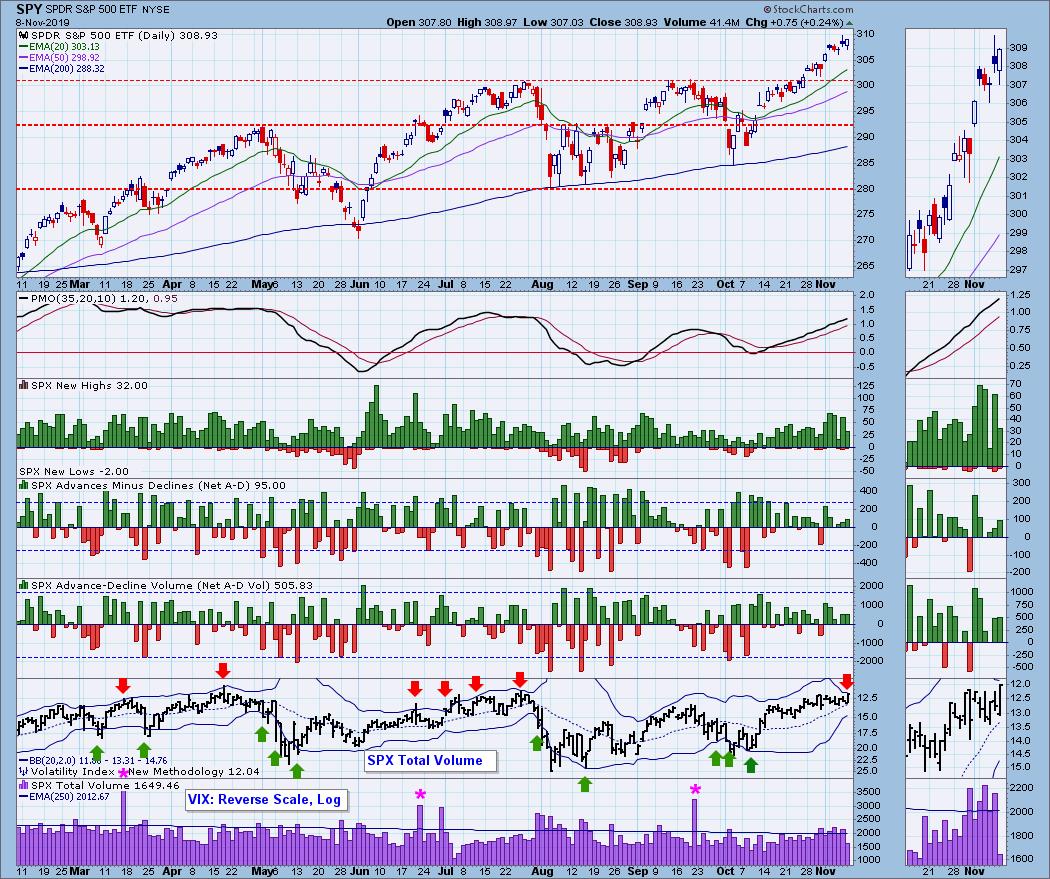
Short-Term Market Indicators: The STO-B and STO-V seem to reflect internal weakness, but we need to remember that, for these indicators, the zero line is like a magnet. Absent sufficient positive pressure, they will drift back toward zero, which is currently the case.
Intermediate-Term Market Indicators: A series of negative divergences dominates this chart. The most concrete indicators are the bottom three panels. The Silver Cross Index shows the precentage of S&P 500 stocks that are on IT Trend Model BUY signals, currently near 70%, the weakest reading this year. Nevertheless, the market still manages to make new highs.
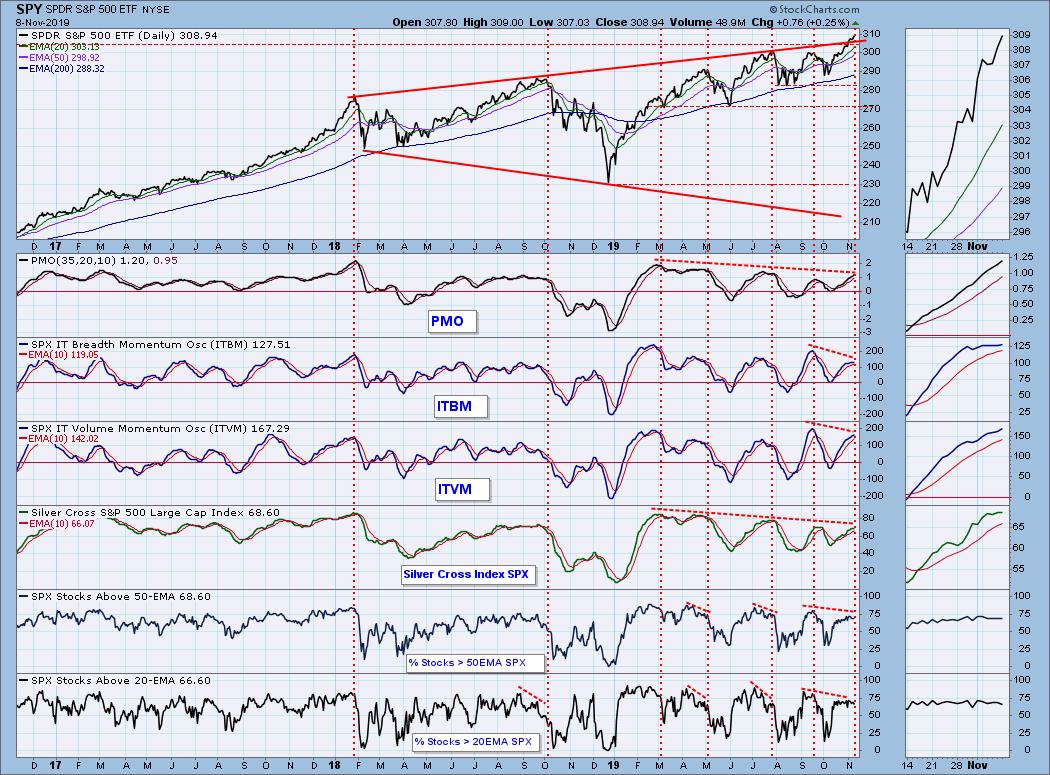
CONCLUSION: It is not exactly a rip-roaring rally, but it is really relentless. Look at the thumbnail charts of the two bottom indicators (stocks above 20EMA and 50EMA) on the chart immediately above. The readings have been unusually steady for indicators that usually chop around quite a bit. We can see a similar pattern just before the early-2018 top. Certain indicators are 15% to 25% lower than their highest readings earlier this year. The situation is precarious. Enjoy your profits, but stay alert.
Note: Options expiration takes place next week. No guarantees, but I usually expect fairly low volatility toward the end of those week.
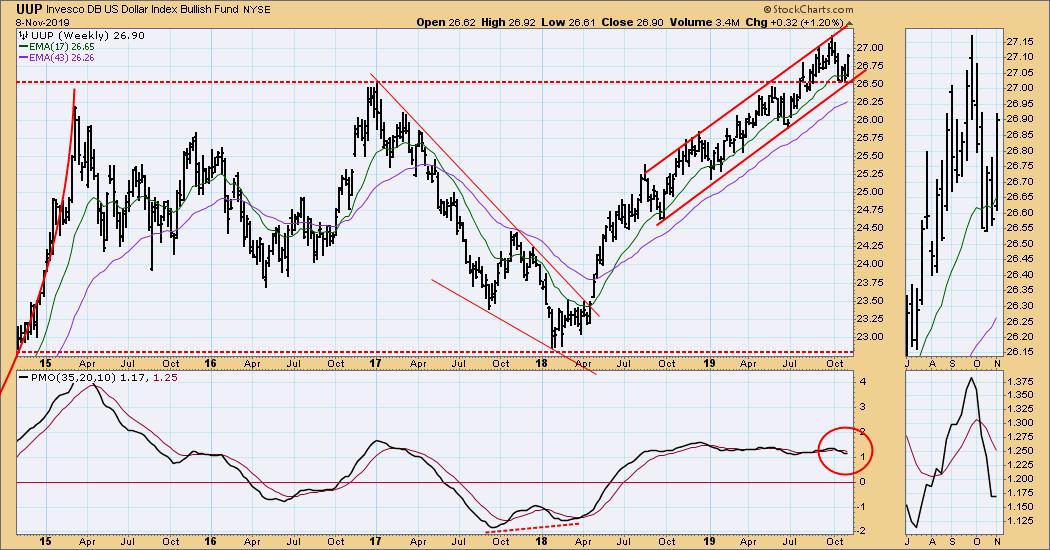
DOLLAR (UUP)
IT Trend Model: BUY as of 11/7/2019
LT Trend Model: BUY as of 5/25/2018
UUP Daily Chart: On Thursday the 20EMA crossed up through the 50EMA, changing the briefly held IT Trend Model NEUTRAL signal back to a BUY. This came about thanks to the double bottom fulfilling expectations by crossing up through the confirmation line. The minimum upside price target has been reached, and the daily PMO has bottomed at the low end if the one-year range. Higher prices are likely.
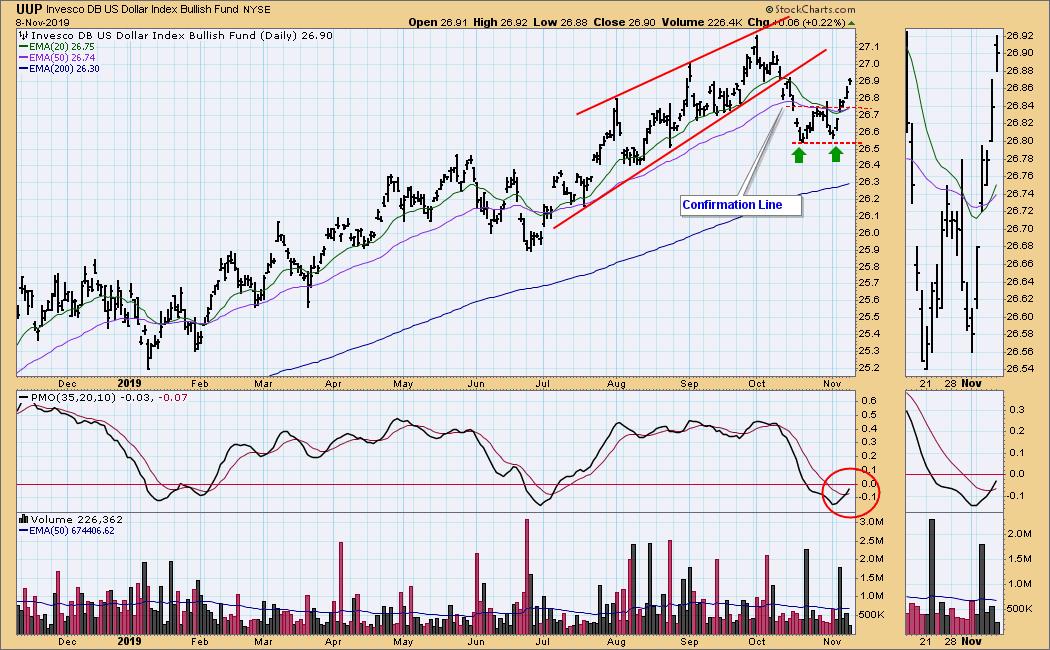
UUP Weekly Chart: In this time frame we can see a nearly two-year advance, which has been very orderly for most of the time. Note the weekly PMO has been positive and flat since mid-2018, a sign of price stability.
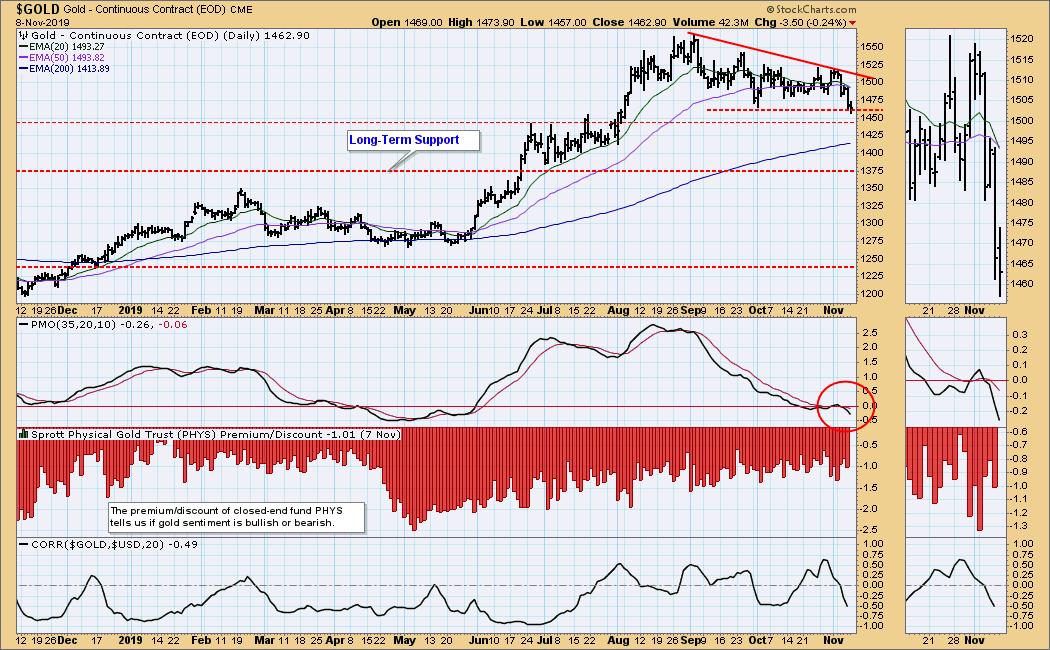
GOLD
IT Trend Model: NEUTRAL as of 11/8/2019
LT Trend Model: BUY as of 1/8/2019
GOLD Daily Chart: On Friday the 20EMA crossed down through the 50EMA, changing the IT Trend Model signal from BUY to NEUTRAL. Gold has encountered the line of support drawn across the October low. If that doesn't hold there is another support line, which begins at the top of the area of congestion that formed in June and July. The most important support is at 1375, the origin of which will be seen on the weekly chart.
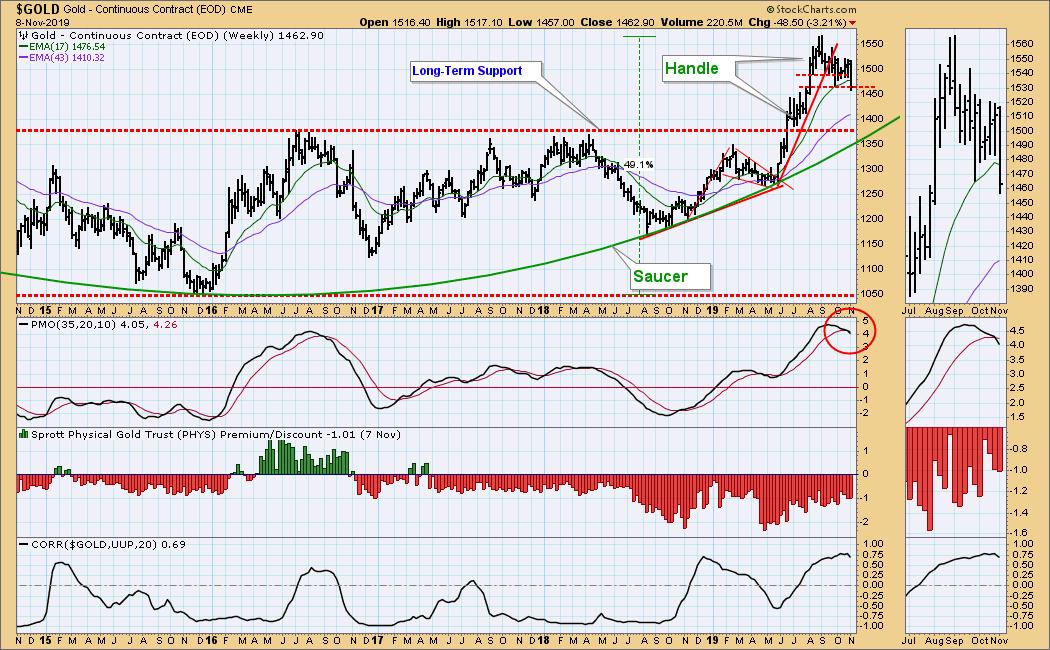
GOLD Weekly Chart: Part of a bullish saucer with handle formation can be seen in this time frame. On the bearish side, the weekly PMO has topped in overbought territory.
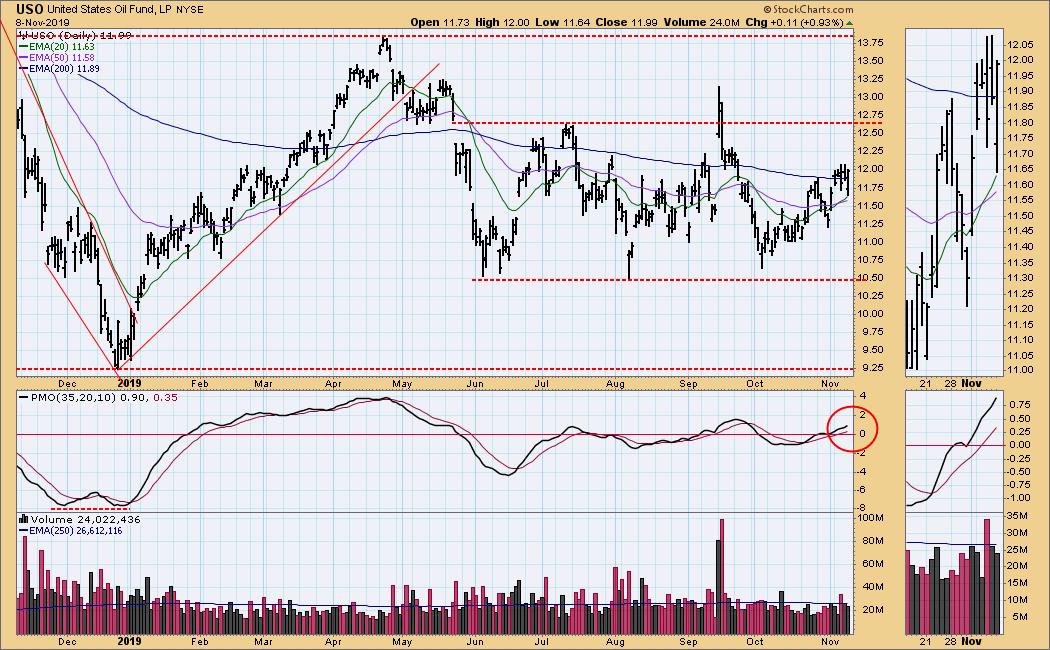
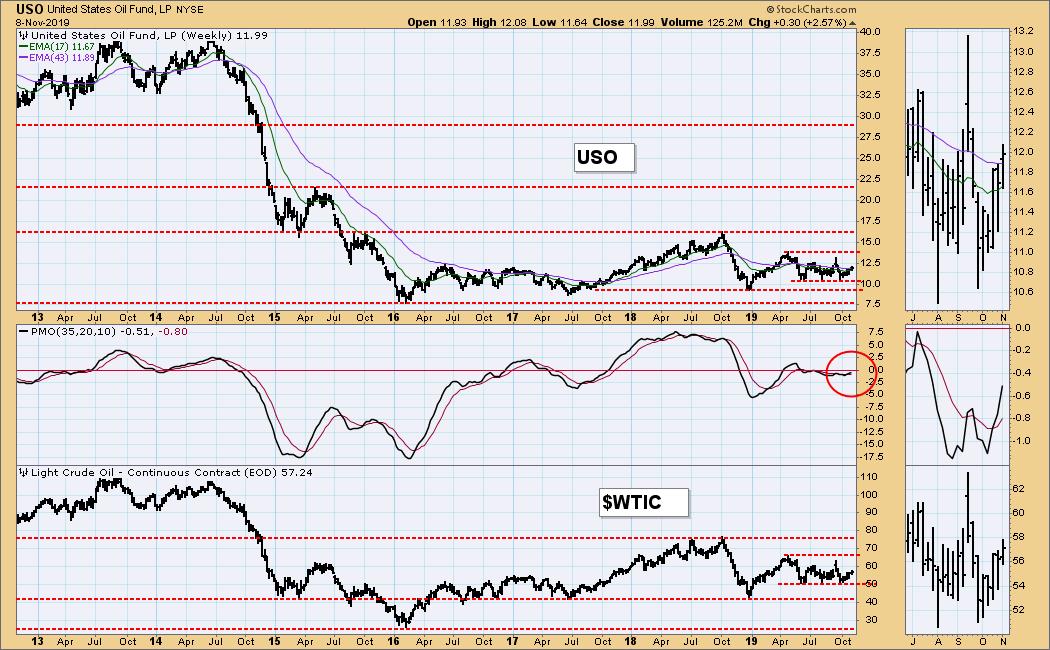
CRUDE OIL (USO)
IT Trend Model: BUY as of 11/6/2019
LT Trend Model: SELL as of 6/4/2019
USO Daily Chart: On Wednesday the 20EMA crossed up through the 50EMA changing the IT Trend Model from SELL to BUY. Crude is right in the middle of a five-month trading range, and the signal change is likely to be another whipsaw.
USO Weekly Chart: The weekly PMO is running sideways around the zero line, which implies more of the same.
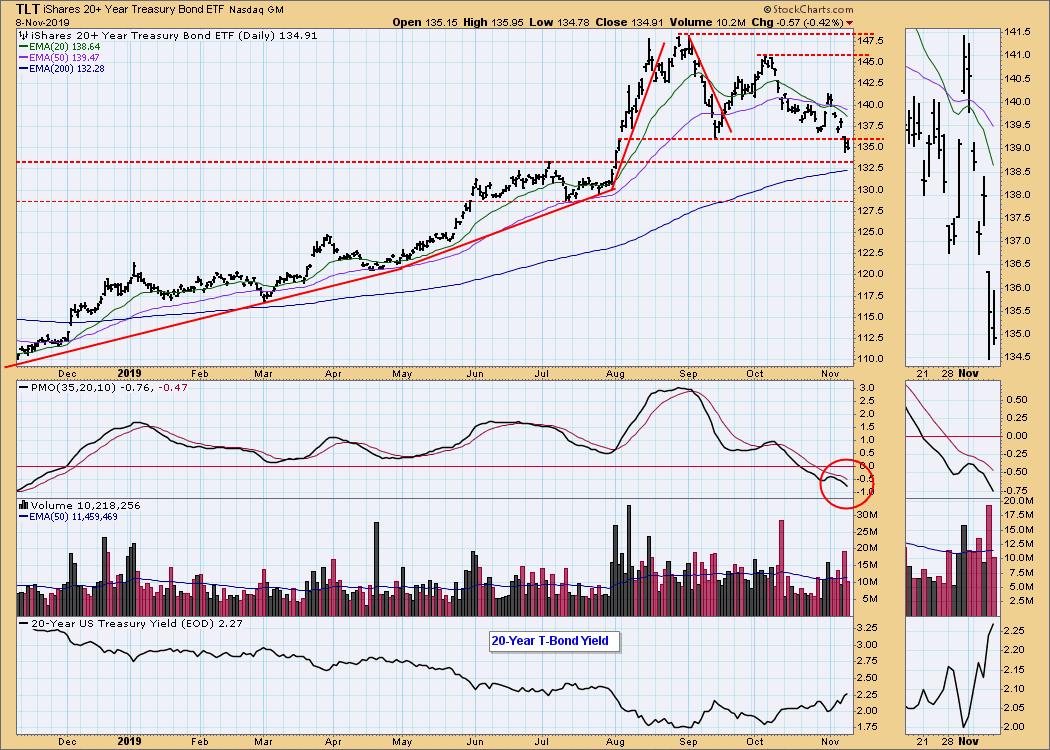
BONDS (TLT)
IT Trend Model: NEUTRAL as of 10/28/2019
LT Trend Model: BUY as of 1/2/2019
TLT Daily Chart: Price has dropped below the support line drawn across the September low, and the next support is immediately below.
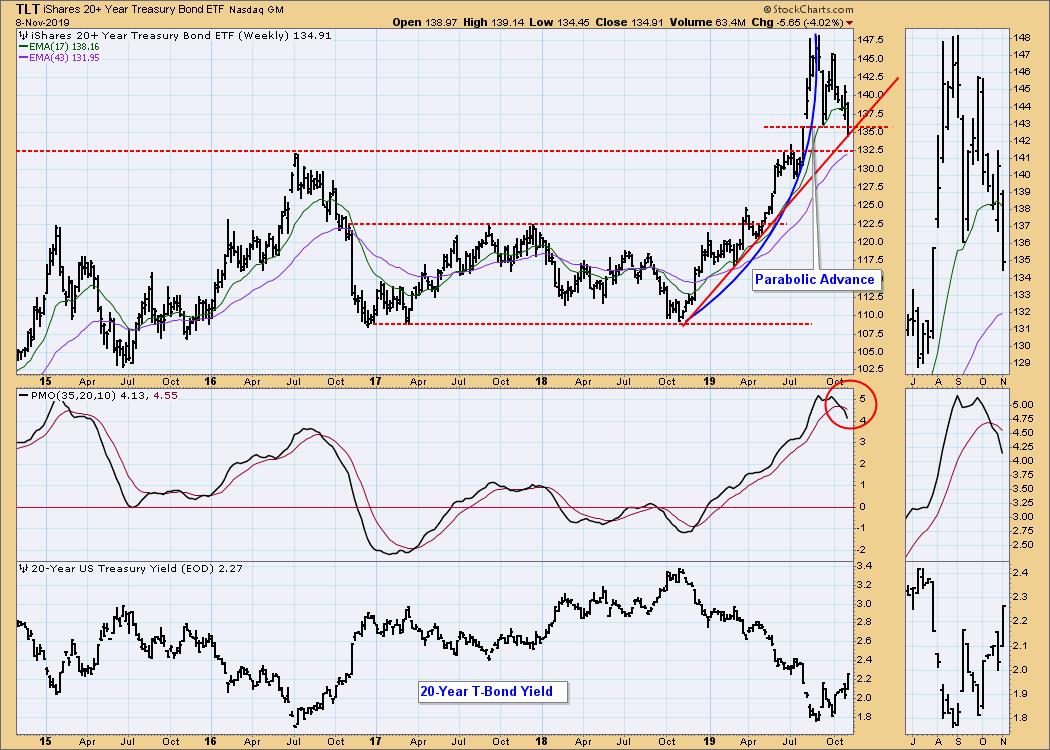
TLT Weekly Chart: In this time frame we can see the source of current problems was the break down from a parabolic advance. Currently, a rising trend line has come into play, but the most solid support is the long-term line drawn across the 2016 and 2019 tops.
**Don't miss any of the DecisionPoint commentaries! Go to the "Notify Me" box toward the end of this blog page to be notified as soon as they are published.**
Technical Analysis is a windsock, not a crystal ball.
Happy Charting! - Carl
NOTE: The signal status reported herein is based upon mechanical trading model signals, specifically, the DecisionPoint Trend Model. They define the implied bias of the price index based upon moving average relationships, but they do not necessarily call for a specific action. They are information flags that should prompt chart review. Further, they do not call for continuous buying or selling during the life of the signal. For example, a BUY signal will probably (but not necessarily) return the best results if action is taken soon after the signal is generated. Additional opportunities for buying may be found as price zigzags higher, but the trader must look for optimum entry points. Conversely, exit points to preserve gains (or minimize losses) may be evident before the model mechanically closes the signal.
Helpful DecisionPoint Links:
DecisionPoint Shared ChartList and DecisionPoint Chart Gallery
Price Momentum Oscillator (PMO)
Swenlin Trading Oscillators (STO-B and STO-V)


