Don't Ignore This Chart! October 31, 2013 at 03:02 PM
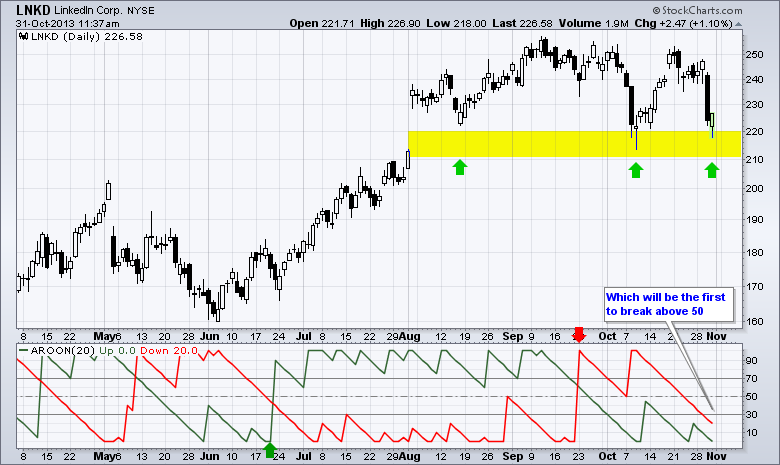
LinkedIn (LNKD) was hit with a high volume decline on Wednesday, but managed to firm near a support zone on Thursday. Support stems from the mid August and early October lows. The indicator window shows the Aroon indicators converging below 30... Read More
Don't Ignore This Chart! October 30, 2013 at 09:46 PM
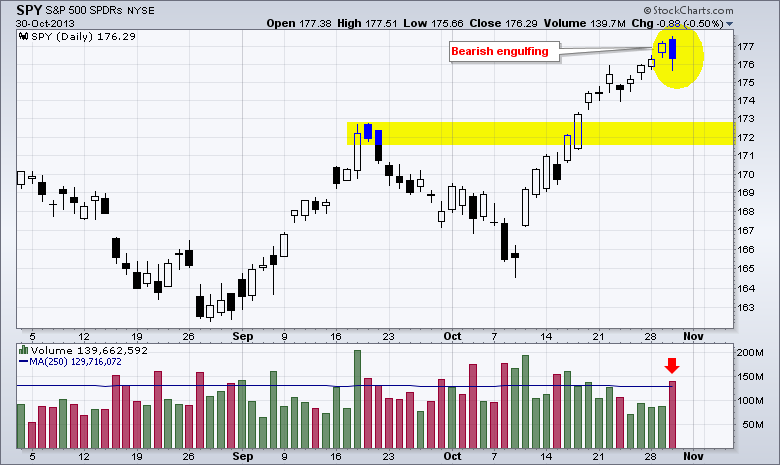
With a strong open and weak close, dozens of stocks and ETFs made the bearish engulfing scan on Wednesday. These patterns form when the current open is above the prior close and the current close is below the prior open... Read More
Don't Ignore This Chart! October 30, 2013 at 12:29 PM
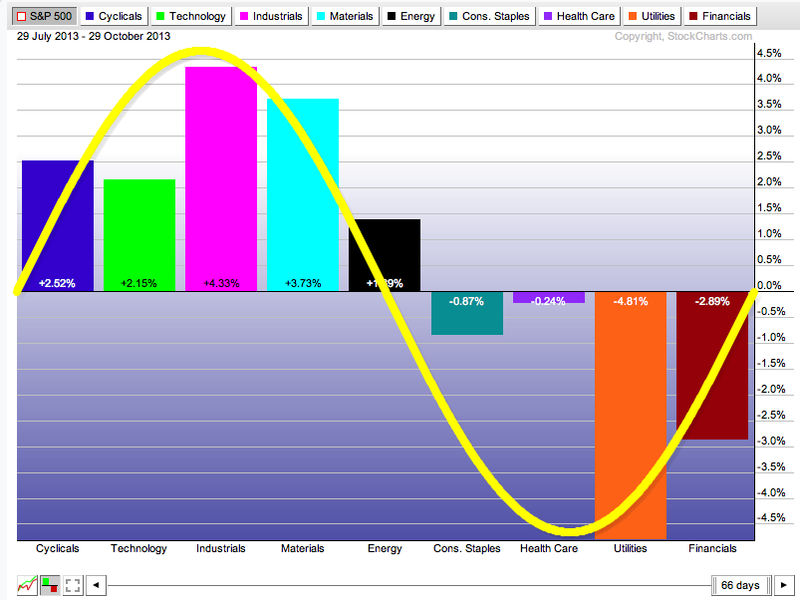
We're finally back to seeing an "orderly" sector rotation situation on the 3-month S&P Sector PerfChart: The "offensive sectors" on the left of the chart are all positive while the "defensive sectors" are all now below zero... Read More
Don't Ignore This Chart! October 29, 2013 at 04:04 PM
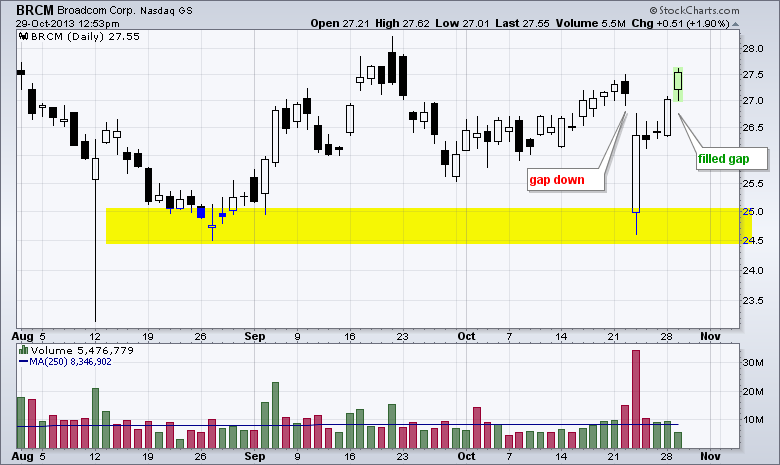
BroadCom (BRCM) gapped down after an earnings miss and opened near 25 last week. The stock hit its low in the first 30 minutes with a spike in volume (6 million). The stock subsequently rallied and ended the day with over 30 million shares... Read More
Don't Ignore This Chart! October 28, 2013 at 10:42 PM
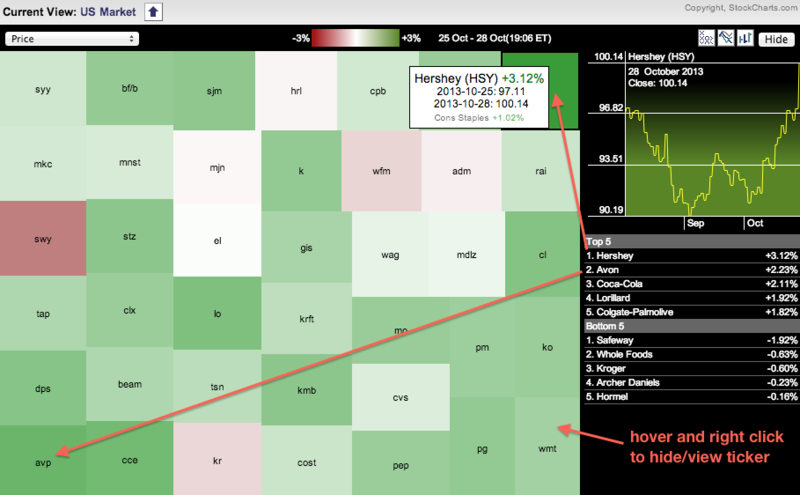
The Consumer Staples SPDR (XLP) surged above its May-September highs and recorded a 52-week high with a big move over the last three weeks. A look at the Sector Market Carpet shows Hershey (HSY), Avon (AVP) and Coca-Cola (KO) leading with 2+ percent gains on Monday... Read More
Don't Ignore This Chart! October 25, 2013 at 03:35 PM
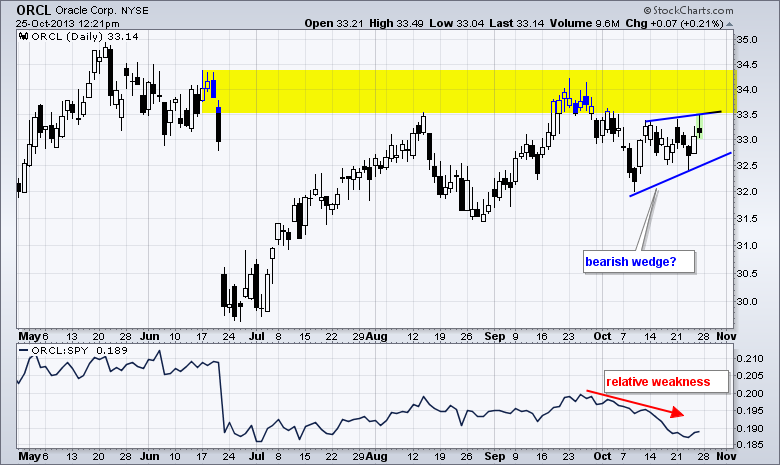
Oracle (ORCL) held its own from July to September, but weakened in October and showed relative weakness. The indicator window shows the price relative turning down and breaking below the August-September lows... Read More
Don't Ignore This Chart! October 24, 2013 at 02:33 PM
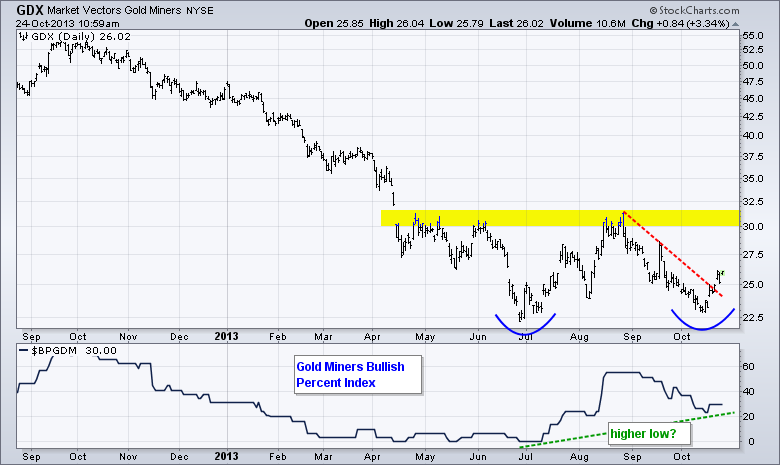
The Gold Miners ETF (GDX) got a nice bounce the last seven days with a break above the late August trend line. Even though the big trend remains down, the short-term trend is now up with this small breakout... Read More
Don't Ignore This Chart! October 23, 2013 at 04:33 PM
Our good friend Martin Pring has contributed today's episode of "Don't Ignore This Chart!" In case you aren't familiar with his work, Martin has authored over 15 books on the subject of Technical Analysis including the classic "Technical Analysis Explained... Read More
Don't Ignore This Chart! October 22, 2013 at 06:52 PM
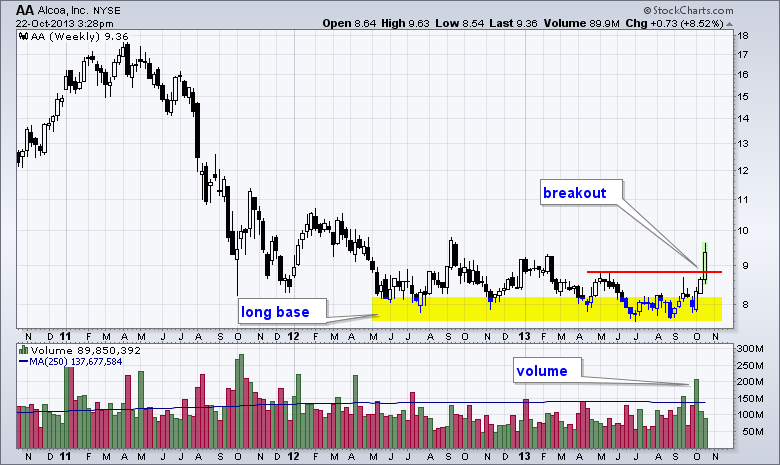
Alcoa moved below 9 in mid 2012 and proceeded to form a long base over the last 15 months. This base gave way to a reversal with a surge above 9 and a 52-week high (intraday). Also notice that the surge started with strong volume... Read More
Don't Ignore This Chart! October 21, 2013 at 08:57 PM
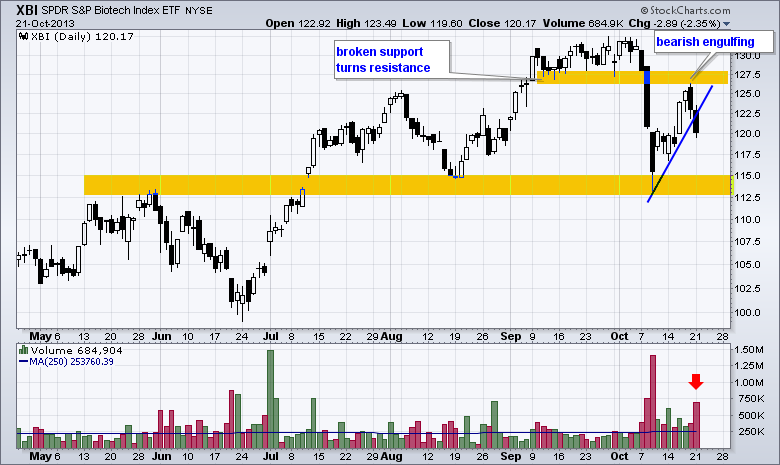
A short-term breakdown is in the works for the Biotech SPDR. The ETF returned to broken support and this zone turned into resistance as a bearish engulfing formed on Friday. The ETF followed up this reversal pattern with a trend line break on high volume... Read More
Don't Ignore This Chart! October 18, 2013 at 11:04 AM
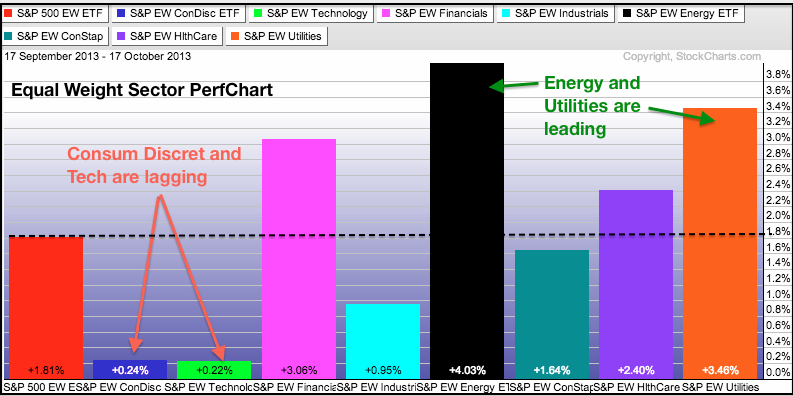
The S&P Equal Weight ETF (RSP) is up some 1.81% over the past month, but the Equal-weight Consumer Discretionary ETF (RCD) and Equal-weight Technology ETF (RYT) are up much less. These two "offensive sectors" are underperforming the broader market... Read More
Don't Ignore This Chart! October 17, 2013 at 02:58 PM
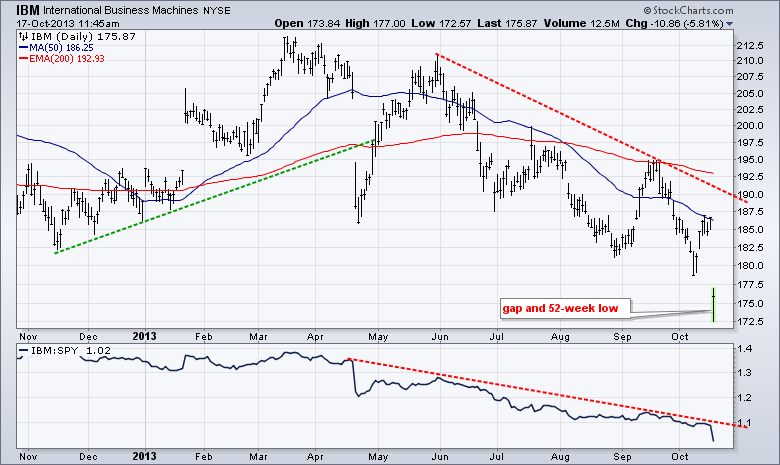
IBM, also known as big blue, is weighing on the market with a gap down and 52-week low. This is not the first sign of weakness though. Notice that the stock peaked way back in March and its 50-day crossed below its 200-day in early August... Read More
Don't Ignore This Chart! October 16, 2013 at 07:03 PM
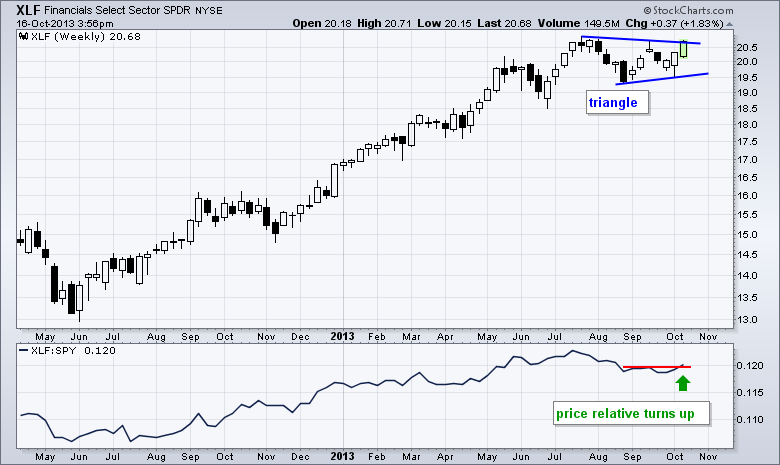
The Finance SPDR (XLF) led the market higher with a 1.83% surge on Wednesday. With this move, XLF is challenging triangle resistance and the September high. A breakout would signal a continuation of the bigger uptrend and argue for new highs... Read More
Don't Ignore This Chart! October 15, 2013 at 12:56 PM
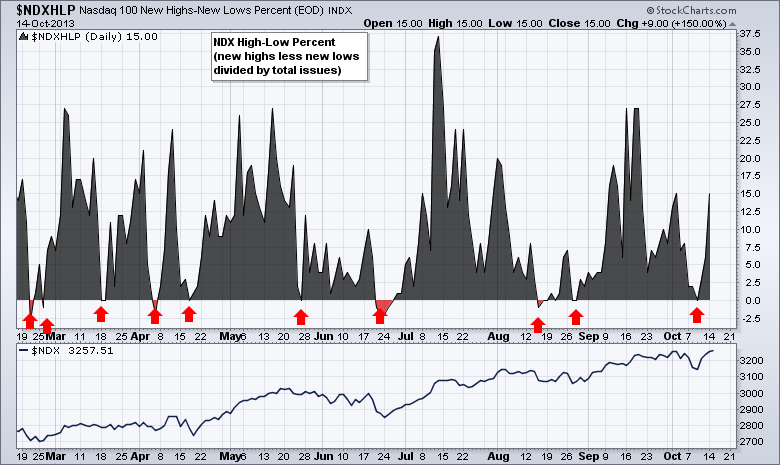
Despite a few negative dips, Nasdaq 100 High-Low Percent ($NDXHLP) has been mostly positive throughout 2013. The red arrows show the brief, and shallow, dips into positive territory. Last week's dip did not last long as High-Low Percent surged to 15% this week... Read More
Don't Ignore This Chart! October 11, 2013 at 10:16 AM
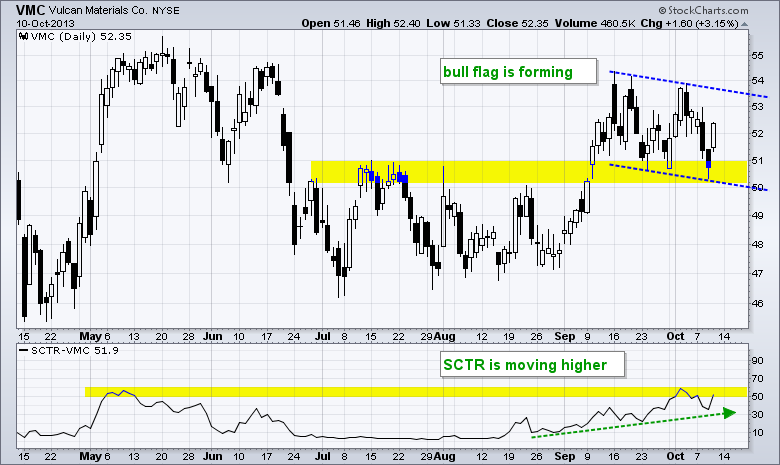
The StockCharts Technical Rank (SCTR) for Vulcan Materials surged above 50 to record the second biggest SCTR gain among S&P 500 stocks. On the price chart, the stock broke resistance with the Septmeber surge and broken resistance turned support as a bull flag formed... Read More
Don't Ignore This Chart! October 10, 2013 at 02:25 PM
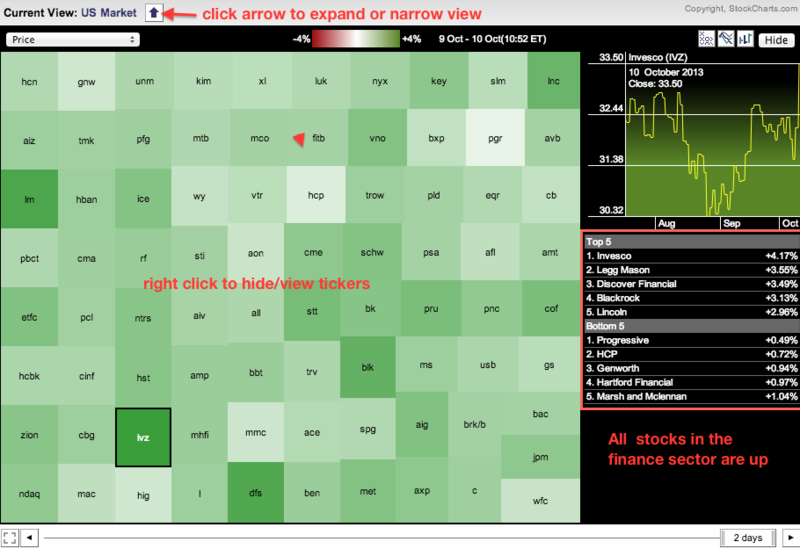
The finance sector is leading Thursday's market rebound with all stocks in the sector showing gains in early trading. The image below shows the market carpet for the finance sector and all components are green today... Read More
Don't Ignore This Chart! October 09, 2013 at 01:06 PM
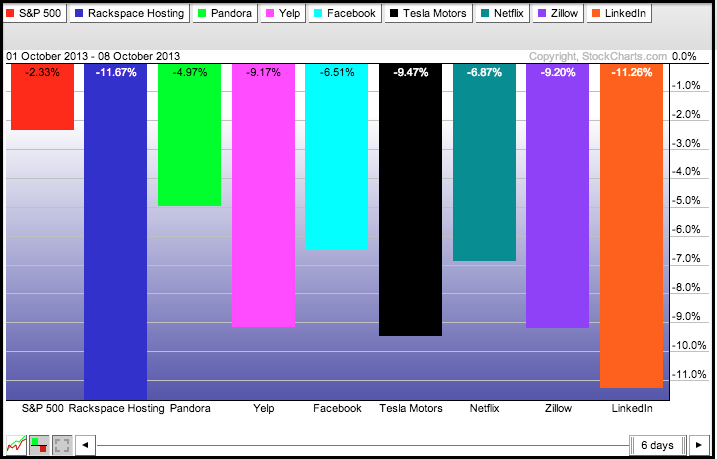
After recording new highs just a few weeks ago, the darlings of the stock market were hit hard as traders sold risk and sought relative safety. LinkedIn (LKND), Tesla (TSLA), Yelp (YELP) and RackSpace (RAX) fell more than 9% in the last five days... Read More
Don't Ignore This Chart! October 08, 2013 at 02:35 PM
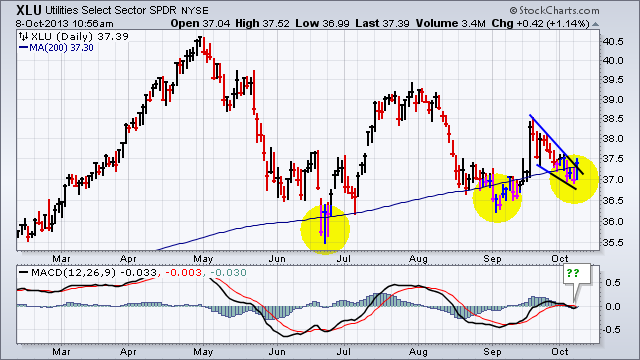
The Utilities SPDR (XLU) is battling the rising 200-day moving average for the third time in five months. Since surging above 38 in mid September, the ETF pulled back with a falling wedge... Read More
Don't Ignore This Chart! October 07, 2013 at 09:36 PM
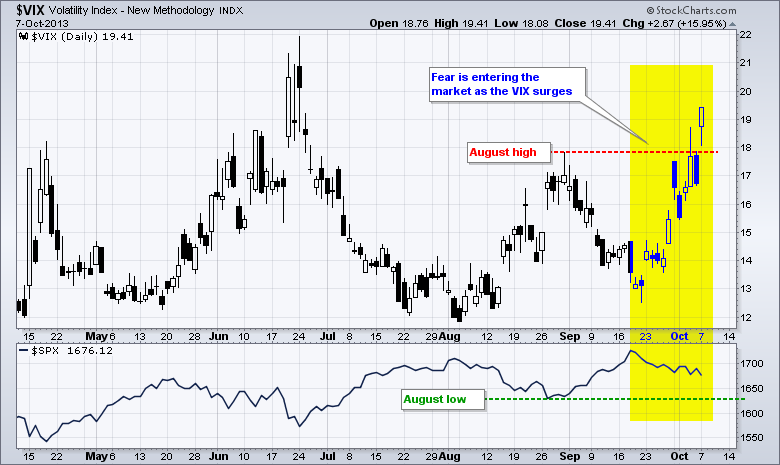
The volatility premium rose sharply as the VIX surged 50% and hit a three month high. The chart below shows the VIX rising from the 13 area to 19.41 in less than three weeks... Read More
Don't Ignore This Chart! October 04, 2013 at 06:35 PM
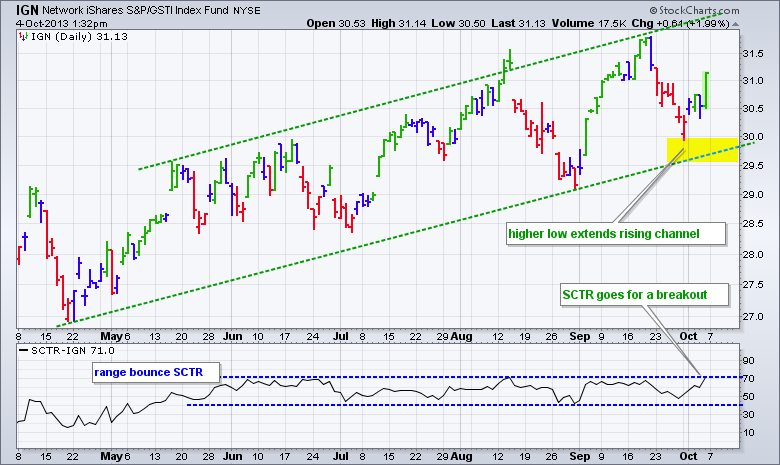
The Networking iShares (IGN) declined sharply in late September, but managed to hold above its prior low and keep the rising channel in place. With a big surge on Friday, the Elder Impulse bar turned green to signal an upturn in momentum... Read More
Don't Ignore This Chart! October 03, 2013 at 03:00 PM
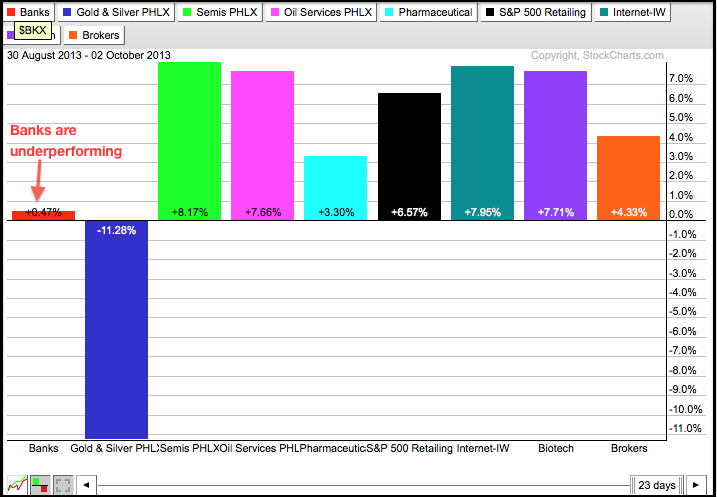
The PerfChart below shows the performance for John Murphy's key industry groups over the past month. Eight of the nine are up, but the Banking Index ($BKX) is up the least and seriously underperforming. The Gold & Silver Index ($XAU) is down sharply... Read More
Don't Ignore This Chart! October 02, 2013 at 07:24 PM
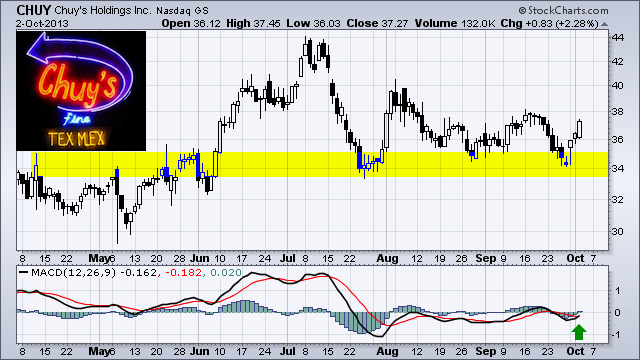
Chuy's Holdings (CHUY) is showing some promise with a bounce off support and bullish MACD cross. Notice that broken resistance turned into support in the 34 area and held from June to September... Read More
Don't Ignore This Chart! October 01, 2013 at 03:19 PM
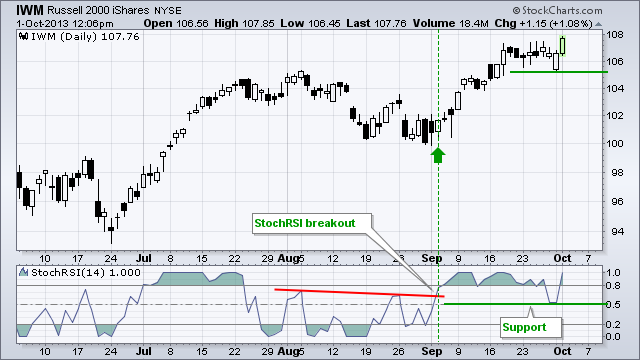
The Russell 2000 ETF (IWM) surged to a new high with two long white candlesticks. Notice how the ETF opened weak on Monday and then moved higher and exceeded the September high. Also notice how StochRSI held support at .50 and moved back above .80 today... Read More
Don't Ignore This Chart! September 30, 2013 at 09:17 PM
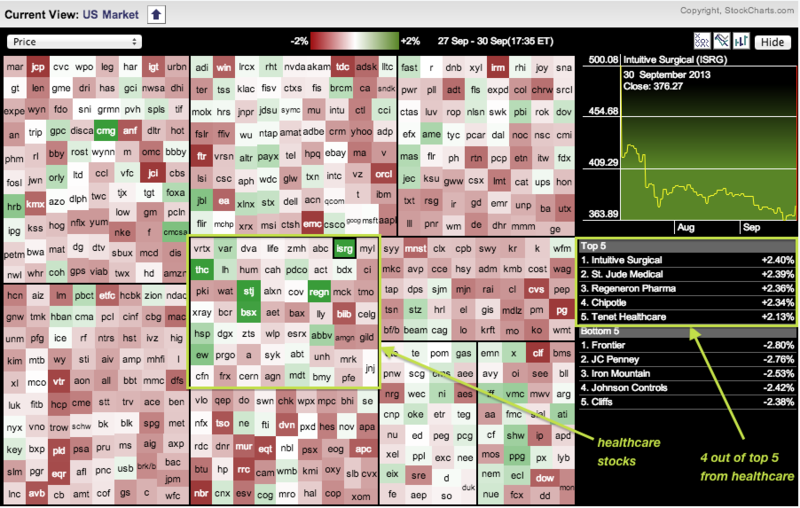
The image below comes from today's sector Market Carpet. Notice that four of the top five performers in the S&P 500 come from the healthcare sector (ISRG, STJ, REGN and THC)... Read More