The XLF ETF - Financial SPDR - is one of the most influential ETF's to support the long term bull market. Bank managers see financial issues before other sectors and the broad array of industries within the financial sector can mask the actual performance of XLF. The sector contains REIT's, Insurance, Regional Banks, and Brokers to name a few. Importantly, the Brokers and Banks are breaking their long trendlines from 2012. Sometimes the long term chart of an entire sector can help us the most as we start to micro analyze the trends. So here is a weekly view of XLF. The last support level before the collapse of Bear Stearns is marked with a blue vertical line near the left of the chart. March 10th was the day the Fed announced a $50 Billion Dollar Fund to aid financials institutions in trouble. In the next 4 days, hedge funds redeemed their assets rapidly and removed underlying capital at Bear. (Source- Street Fighters: Kate Kelly) Interestingly enough, while Bear was getting weaker, the financial markets rallies into April. The low of $21.11 on March 10, 2008 was a very significant low in time. The rally up before Lehman's collapse topped out at $20.21. Now with resistance above, the financial sector plummeted.
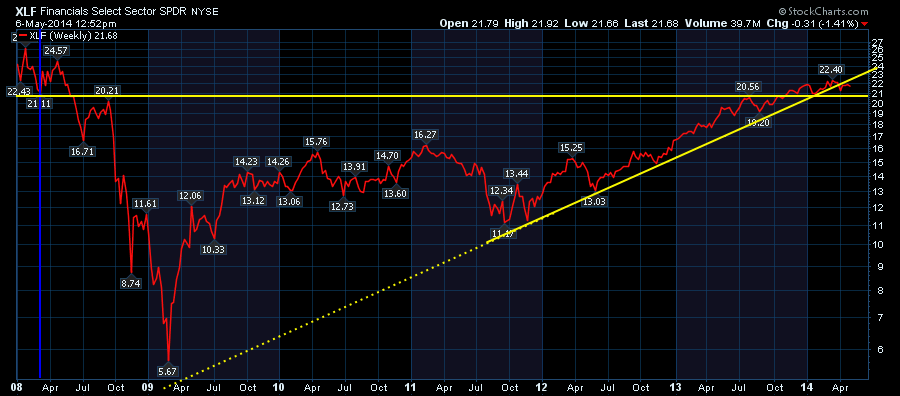
In Q3 2013, the XLF found resistance at $20.56. In the fourth Quarter of 2013, the financials pushed through this significant resistance level. The January 2014 weekly low bounced at $20.98 which is also very close to the intersection of the two yellow trendlines. This horizontal level marks a long term support level after finding resistance, then support within the range before Bear and before Lehman. Between $20.21 and $21.11 we have a solid level where support and resistance are working. Recently, we broke below the upsloping trend line. Now we have a clear level for our long term stop on XLF. Below support of $20.21 would be a clear breach. This $0.90 zone of support is the line to lean on. Until a move either way breaks, we are in an area of caution under the long term uptrend and above the horizontal support.
If you liked this blog, feel free to forward it to investing friends and family. If you didn't like the blog, please send me a note on what we could do better. The charts should be printable. They should also be clickable so that you can go look at the settings.
We try to keep our articles informative and entertaining. Make sure you check out the other blog writer articles in Mailbag, Chartwatchers, Traders Journal, Decision Point and The Canadian Technician. One of the little known secrets of StockCharts is our Blog or Articles section. The Blog tab will bring up a view of some of the most recent articles. StockCharts.com subscribers have two additional daily feature articles.
Lastly, Chartcon 2014 in Seattle is rapidly booking up. Click here for more information.
Good trading,
Greg Schnell, CMT


