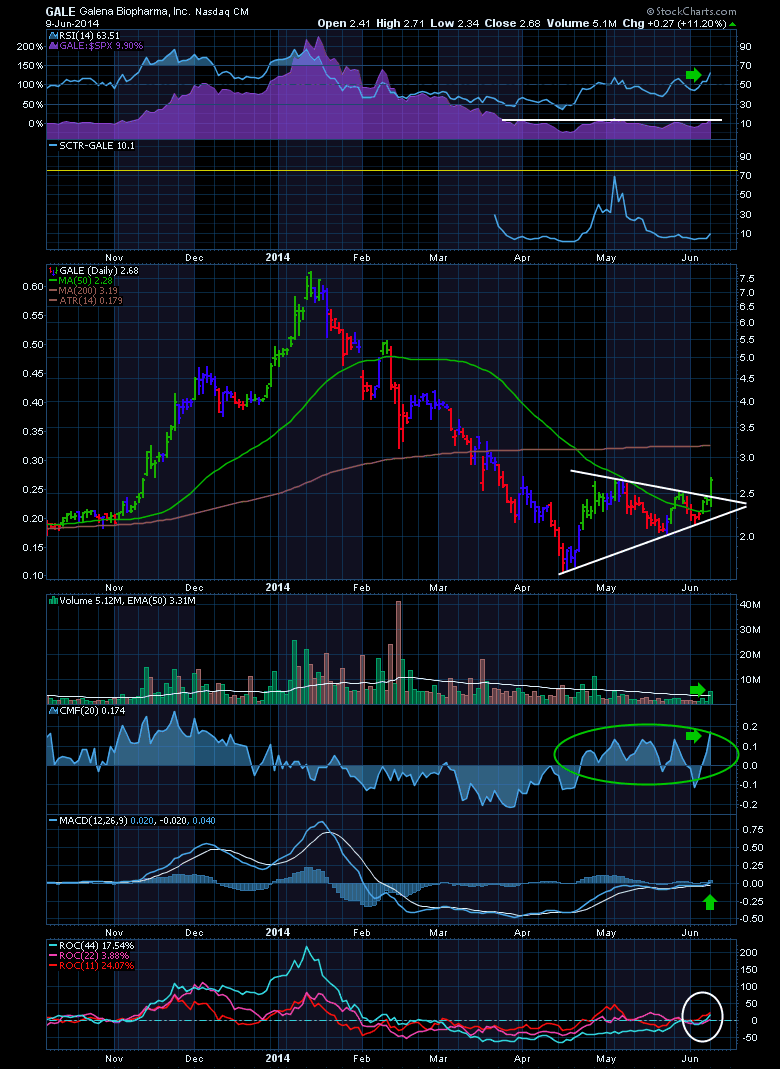
Galena Pharmaceuticals (GALE) is an interesting chart right here.
The Relative strength in purple compared to the $SPX has not broken out yet, but everything else is looking very interesting.
RSI is breaking out to new highs, the price is breaking out from a small basing pattern and the volume today was the biggest in a month.
You can see the CMF (Money Flow) has been in accumulation mode, and now the MACD has turned up. Finally, all of the cycles on the Rate of Change indicators are in sync so they are all turning up together. That can be a very bullish clue.
Its pretty interesting here at 65% off the highs and they just released some Phase 1 data and presented at another conference on the weekend. I have not studied the data presented.
Good trading,
Greg Schnell


