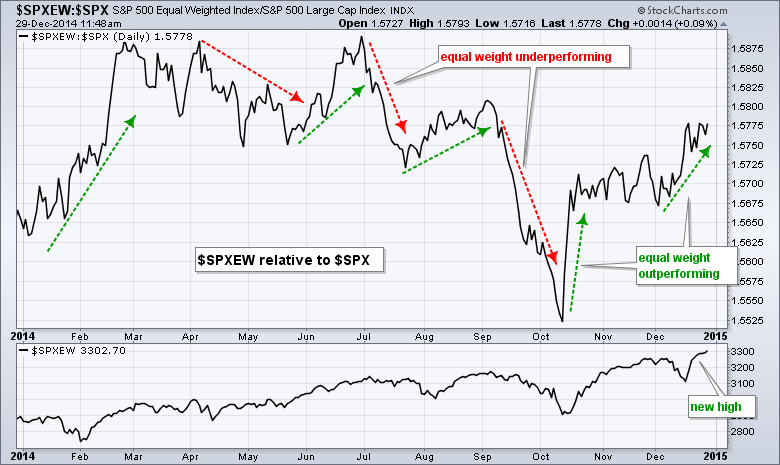
The chart below shows the ratio of the S&P 500 Equal-Weight Index to the S&P 500 ($SPXEW:$SPX). Also known as the price relative, this ratio chart compares the performance of the S&P 500 Equal-Weight Index to the S&P 500. $SPXEW outperforms $SPX when this ratio rises and underperforms when this ratio falls. As we can see on this chart, the equal-weight index has been outperforming the cap-weight index since mid October. This is positive for the broader market because it shows relative strength in the "average" stock in the S&P 500. In other words, this rally since October has been driven by the rank-and-file stocks in the S&P 500, note the generals. The indicator window confirms strength because the S&P 500 Equal-Weight Index hit a new high this week.
Click this image for a live chart.


