$NATGAS had been struggling to hold up in the wake of the recent energy downturn, but in the last week pricing fell apart.
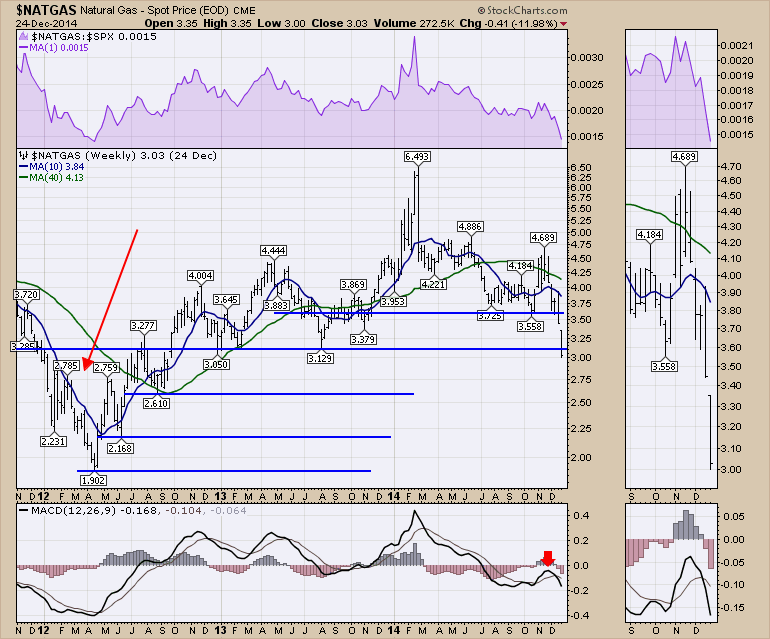
After a vertical climb from the very low $1.90 level to a soaring $6.40, Natural gas closed last week on fresh 52 week lows and continued to plummet to 2 year lows this week. The MACD has turned down on the weekly while below zero, which is never a nice place for a rollover. It suggests more weakness to come. If investors were trying to balance their energy sector allocation risks by moving to companies with an equal mix of Natural Gas and oil production, this might hurt them even more.
It was late in 2011 when Natural Gas went for a substantial slide on its way to record lows. After a brief pause in January 2012, it dropped to the April low. Searching for support levels to help us now, we can see three more levels spaced apart. The levels are $2.60, $2.17 and $1.90.
The bottom line would appear to be that just because it's cold outside doesn't mean there is any warmth to be found in holding Natural Gas related investments here.
Good trading,
Greg Schnell, CMT


