For fundamental investors, the price action is still in the top right corner so why worry? For technicians the bull market message became more muted last week. Some of the main technical indicators rest on charts without understanding the message they send and Friday's signal makes this blog important. The RSI and the MACD on the $SPX are flashing caution signs, but not sell signals. Let's drill into the chart.
The RSI is explained in this ChartSchool article (RSI). The RSI shown below for the $SPX is a more valuable indicator for me on the weekly charts over long periods. Constance Brown explained the RSI ranges in her book. From 40-90 we are in a bull market. Between 10-60 we are in a bear market. We can see the bull market ranges shown in green hold above 40 and that makes for a strong market. The rule is to stay with the trend until the trend is broken. So currently we are in a bull market. The areas shown in red are areas where the price action is weaker leading to lower RSI readings or downright bearish. There are times where the RSI sits in the range of both bullish and bearish.
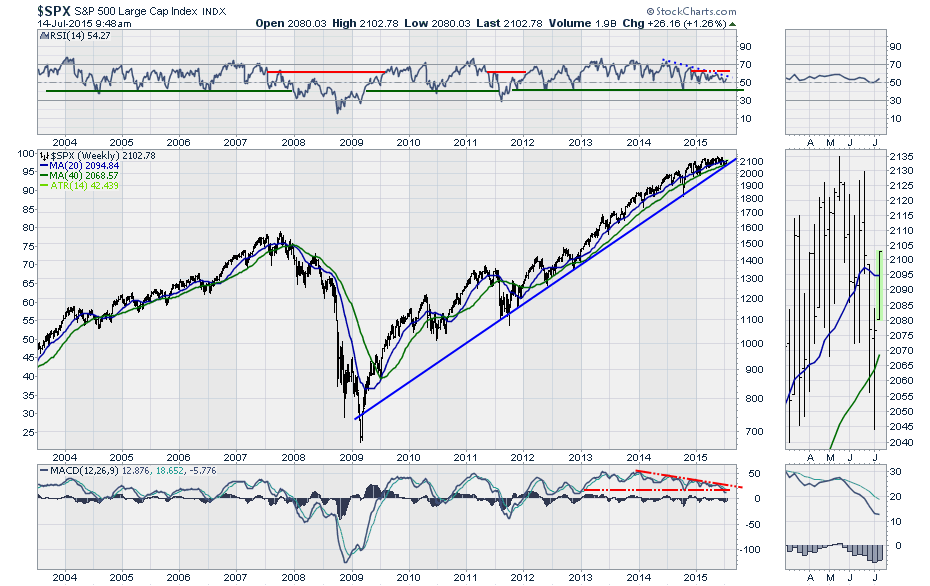
Continuing with the RSI, I have duplicated the chart to stop the scrolling back and forth. Looking left to 2007, we were making lower lows and lower highs on the RSI starting mid year. This divergence while the market was making higher highs and the RSI was making lower highs was important. December's RSI reading below 40 was the first signal of more damage. There is also positive divergence between the October 2008 low and the March 2009 low. Hindsight makes it look easy. Examining the Spring of 2011, the weakness in the RSI could have told us the market was having trouble. But it was only the first bounce off a 45 level. Hardly an ominous sign. Moving to the right edge of the chart to last week, we have spent 9 months below 60 and above 50. The market has not made any progress either. Friday's close was back to levels we were at in November 2014. We also have a series of lower highs creating divergence on the RSI. But we don't have a series of lower lows. The conclusion: We are still in a bull market till proven otherwise, but there are 2 signals (below 60 for a long period, and the negative divergence of the RSI highs) that suggest this could be rolling over.
Meanwhile for fundamental investors, buying the dip has been a rewarding strategy. The $SPX staying above its 200 DMA shown in green has been a pretty good signal to market conditions.
Let's look at the MACD. We can see a MACD above zero is bullish. A nice strong MACD line is well above zero. 2005 and 2006 showed a MACD just bouncing above zero but the market kept progressing. A change in momentum is a more valuable clue to a changing market. The lower bounce level in July 2007 compared to the March low; with a lower high in October 2007 created a warning and as the MACD went below zero and could not recover, it became a major signal. The July bounce in 2011 was also very muted and the market rolled over. So now we have a series of lower highs and lower lows on the MACD that suggest more market weakness than we have seen since the MACD went positive in 2012. This does not mean the end of the bull market. The MACD is still above zero and could bounce along for years. The cautionary signal is the lower low in momentum that we got from last weeks close. Technicians will watch the strength of the bounce and if July 2007 and July 2011 style signals start to form, they will probably exit from much higher levels than fundamental traders.
So for the fundamental investor, guns ablazing, buy the dips. For technicians, guns blazing, buy the dips. The difference is the technicians have decided now is the time to have a backpack with a safety kit ready to deploy should this market start to falter more seriously. Until then, the bull market rides on!
Good trading,
Greg Schnell, CMT


