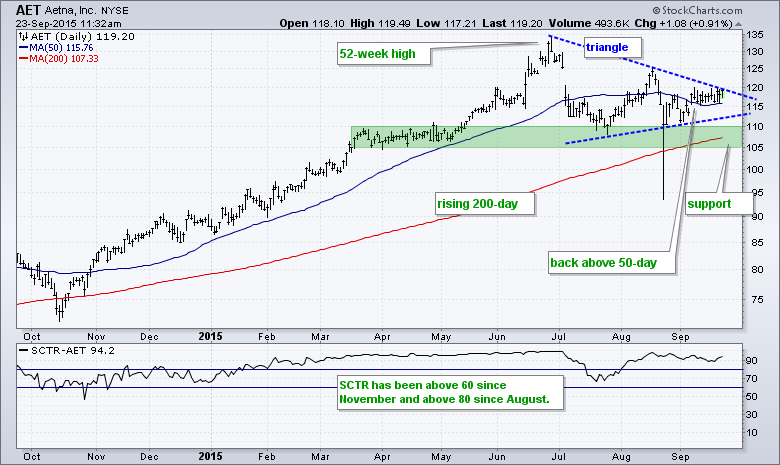
In addition to this successful ad campaign, Aetna sports a bullish looking chart that argues for higher prices. First note that it has been a tough month for stocks with the S&P 500 down around 1.5% month-to-date. Aetna, in contrast, is holding up rather well and up over 4% in September. On the nine-month price chart, the stock hit a 52-week high in late June, gapped down in early July and then formed a triangle over the last few months. Triangles are continuation patterns and the prior uptrend favors an upside breakout (watch 120). Also note the rising 200-day moving average and bounce off the support zone in the 105-110 area. The indicator window shows the StockCharts Technical Rank (SCTR) moving back above 80 in early August and currently above 90. This means Aetna is in the top ten percent for large-cap performance. You can read more about the SCTR in our ChartSchool.
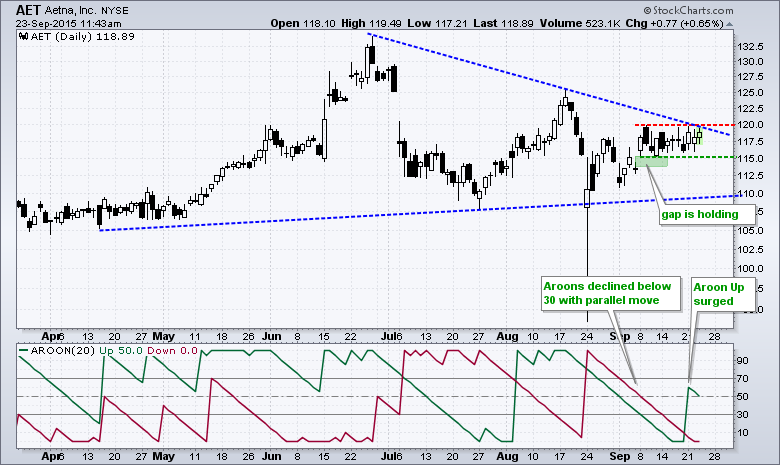
On the six-month candlestick chart, AET gapped up on September 8th and this gap held for over two weeks. The S&P 500 fell back over this period, but AET held strong and showed relative strength. The stock is currently consolidating and I am watching 120 for a bullish breakout. Failure to breakout and a move below 115 would argue for a reassessment. The indicator window shows Aroon Up surging above Aroon Down and exceeding 50. Notice how both Aroons declined below 30 with a parallel move. This happens during a consolidation and a subsequent Aroon cross is the first directional clue. You can read more about the Aroons in our ChartShool.
******************************************
Thanks for tuning in and have a great day!
--Arthur Hill CMT
Plan your Trade and Trade your Plan
*****************************************


