One cool feature at StockCharts.com is the ability to check the seasonal tendencies of stocks. For instance, I can tell you that Amazon.com (AMZN) performs its best during the month of September, which is odd because September is the worst month of the year historically for the S&P 500. But the seasonality tool goes beyond just looking at performance of a stock or index by calendar month. You can compare stocks within that seasonal perspective. Let's take Nike (NKE) and Skechers (SKX) as an example. The picture below illustrates how much better NKE performs late in the calendar year than SKX. The September and October outperformance of NKE dating back 17 years is astounding. Check it out:
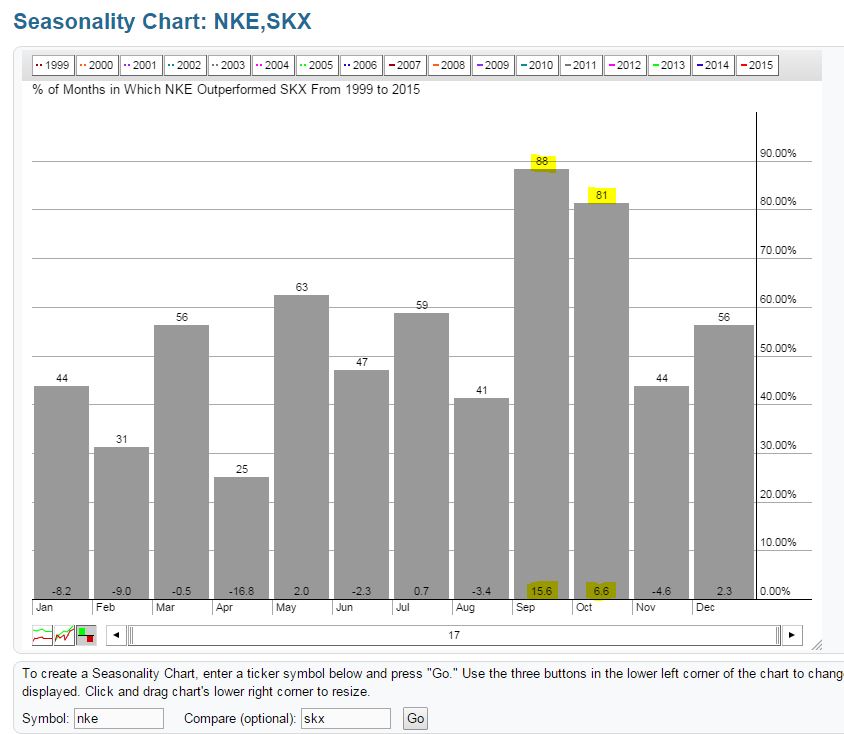
The above tells us that NKE has outperformed SKX 88% of the time during September and outperforms by a whopping 15.6% on average. While October swings a little less wildly in NKE's favor, it's still a much better month for NKE than for SKX. Clearly, the first four months of the year belong to SKX. So when choosing between two stocks in the same industry, it might behoove you to check out the seasonality tool before you commit.
Happy trading!
Tom
