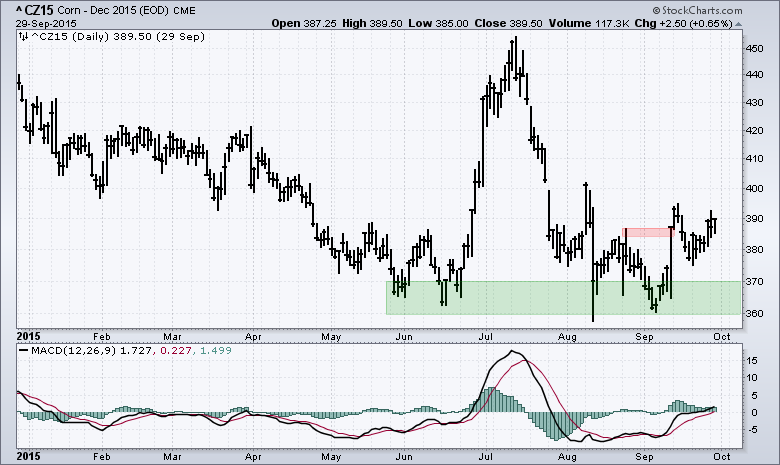
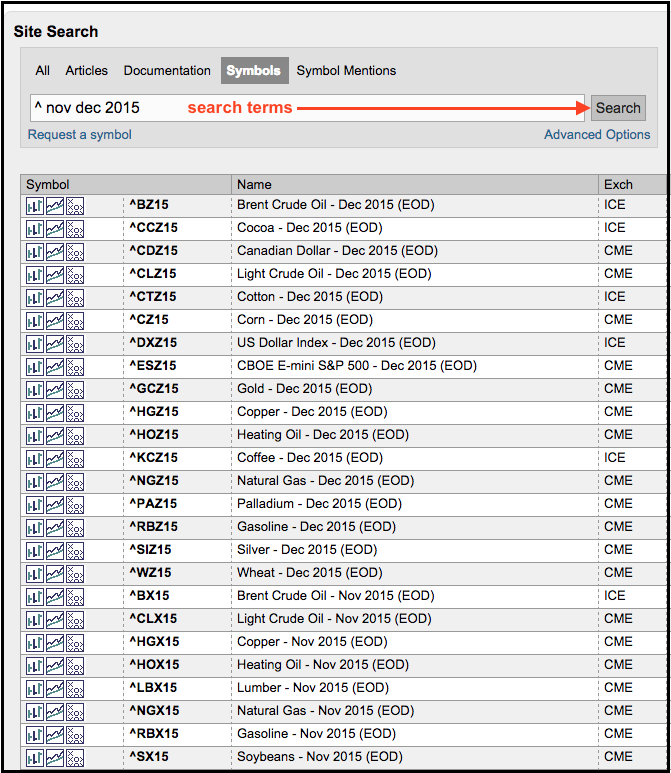
Corn is showing signs of firming near the June lows and a possible wave 2 could be ending for the Corn Trust ETF (CORN). I will first start with December Corn Futures (^CZ15) because this is the most widely traded instrument for corn. Note that StockCharts provides end-of-day (EOD) data for dozens of commodities and these symbols begin with a caret (^). Chartists simply need to search the symbol catalog for ^ to see them all. I will include an example at the end of this commentary. Turning back to corn, the futures contract surged in June-July and then fell all the way back to the June lows in August-September. It looks like these lows are holding because corn surged off the support zone in mid September. The indicator window shows MACD (12,26,9) moving into positive territory for the first time since July.
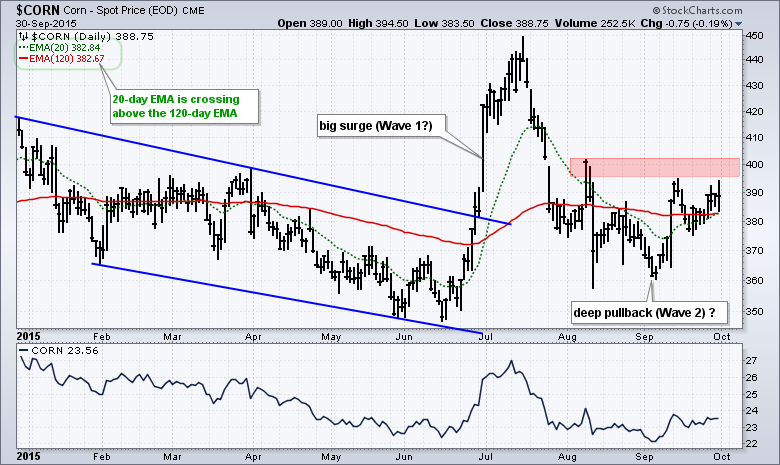
The next chart shows Spot Corn ($CORN) in the main window and the Corn ETF (CORN) in the indicator window. Notice that spot corn held above its June lows in August-September. This means we have a possible Wave 2 pullback on our hands. I don't do much Elliott Wave, but it was required for the CMT and I learned that second Wave pullbacks can be very deep. The only requirement is that Wave 2 holds above the prior low. The June-July surge was certainly strong and could be indicative of a Wave 1 move. If this is Wave 2, then a breakout around 400 would signal the start of Wave 3.
Here is a list of some futures symbols that we carry
******************************************
Thanks for tuning in and have a good day!
--Arthur Hill CMT
Plan your Trade and Trade your Plan
******************************************


