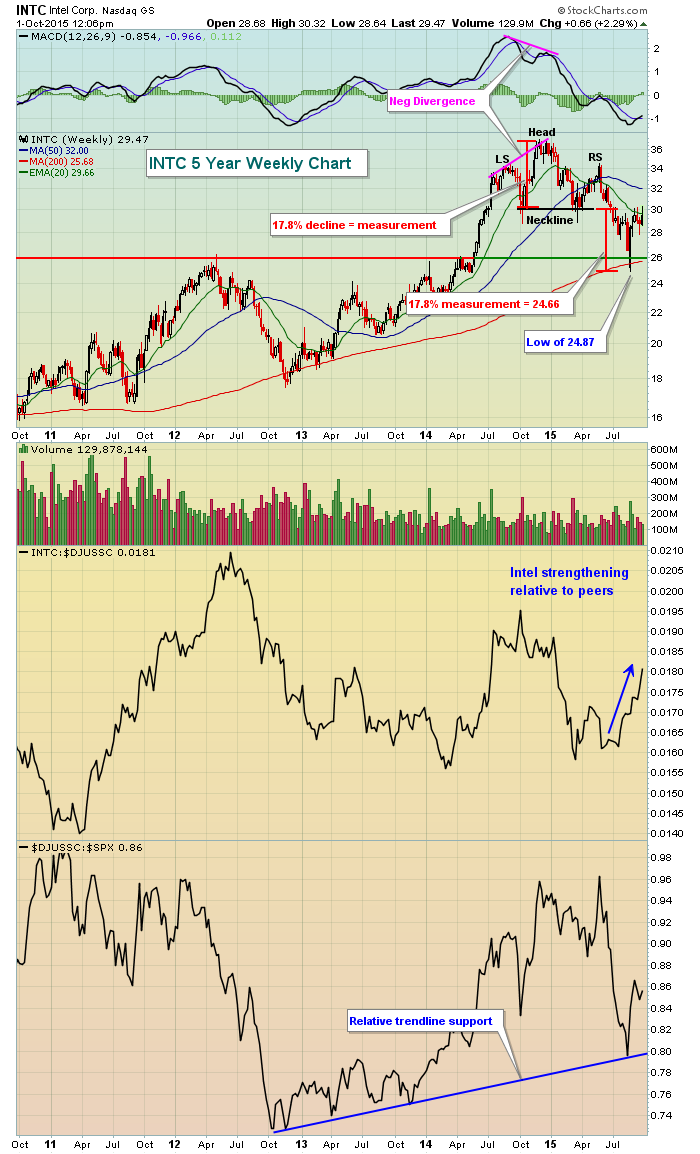
Actually, this chipmaker's chart looks very strong, especially longer-term. After a strong advance in late 2014, a negative divergence emerged and was followed by a topping head & shoulders pattern. The measurement of that pattern - from the top of the head to the neckline -was roughly 17.8%. Once neckline support was lost, the measurement is determined by another 17.8% decline, or a drop to roughly 24.66. Several weeks ago, INTC found its bottom at 24.87, not far from reaching that measurement/downside target. Now INTC is rebounding and it's doing so with nice relative strength vs. its peers and at a time when semiconductors have held relative trendline support vs. the S&P 500. On Wednesday, INTC closed back above 30.00, an important short-term resistance level but is currently trading back beneath that level today. On this weekly chart, we need to see a weekly close above 30.00 to trigger a buy signal. In the meantime, more short-term weakness down to test recent price support near 28.00 could suggest building a long position as well. Have a look at this 5 year weekly chart:
Happy trading!
Tom


