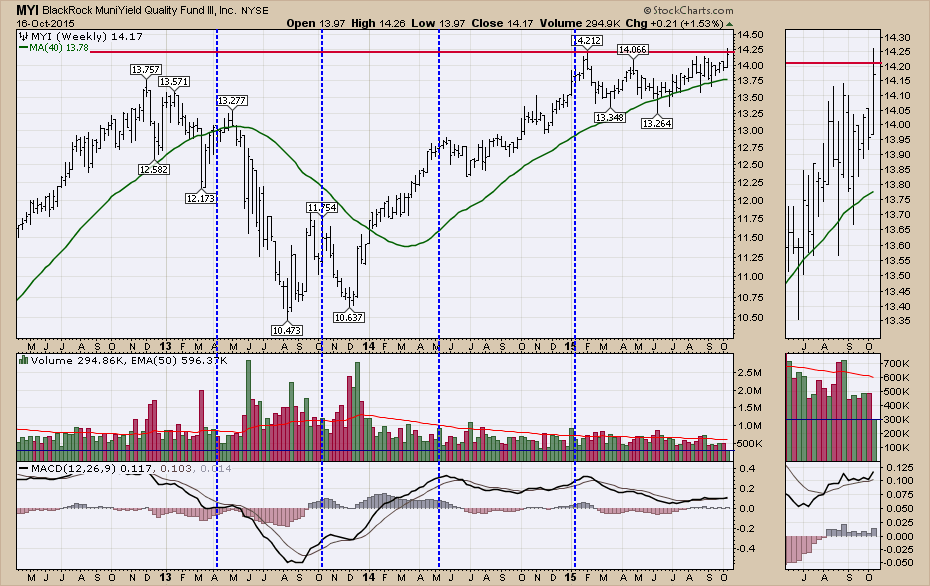
BlackRock runs a Municipal Bond Fund (MYI) that I follow. When these municipal bond funds are rallying to new 52 week highs, I interpret the leadership position as a defensive one, not an offensive one for the equities market generally. This one needs a little more work to analyze this week. This chart actually pushed through the previous intra-week highs and settled back a little bit, but this is the highest close. Back in 2012 when this topped out, the stock markets were starting the beginning of a new 3-year run. I did notice one thing on the chart that was very odd. This ETF had the lowest volume week in 3 years presented as shown by the horizontal line through the volume chart. The volume was 60% of normal weekly volume shown in a red 50 WMA. There are other low volume locations on the chart, but the four blue lines are sitting just to the left of low volume weeks that preceded declines. The major top in 2012 had a very low week in it, but it was 6 weeks before the top.
The new high makes me think this defensive posture should be respected. The lack of volume makes it very suspect. The reason for my interest here is I like to use it with direction for the 10-year and 30-year bonds. As Martin Pring pointed out in his article this afternoon, lots of the bond charts are at critical trend lines. Breaks through the trend lines would be a major signal to get defensive. A bounce off these lines would say sell the bonds.
This chart suggests buying them with the new high as a signal. The old saying, 'you are not in a bear market when you are making new highs', rings true. That said, the major slump in volume suggests watching closely.
Good trading,
Greg Schnell, CMT


