Over the past three weeks, Qualcomm (QCOM) has rallied from a low of 52.17 to Friday's close at 59.91 - barely eclipsing the falling 20 week EMA currently at 59.78. Has that 15% recovery signaled that the worst is over? Or is this just the bounce before the next leg lower? Technically, until conditions change, I'd favor the latter. First, let's take a look at the chart and then I'll provide my thoughts:
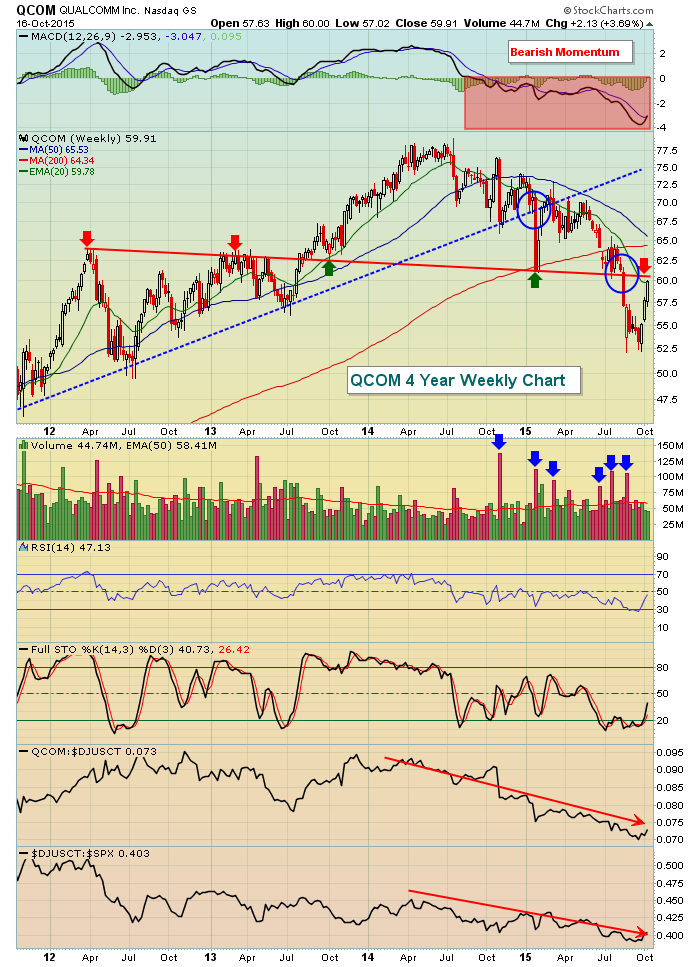
There's a lot on this chart, but let me quickly summarize. At the bottom of the chart, you'll see the two lines pointing lower. These tell us that QCOM has been underperforming its peers for the last two years and its industry group has been lagging the S&P 500 throughout this bull market. So QCOM is a weak stock in a weak industry group. At its recent price low three weeks ago, QCOM had a weekly RSI that dipped below 30 for the first time in the last four years. It was very oversold and we've since seen a bounce. Note that the volume the past three weeks has been below the 50 week EMA. Six blue arrows mark very heavy volume selling endured over the past year. The two blue circles highlight significant technical breakdowns - the first of which broke long-term trendline support and the second broke the price support established from the first breakdown. The weekly MACD was pointing lower at the last price low indicating that strong bearish momentum remains just as QCOM bounces on lighter volume to test price and trendline resistance (last red arrow to the right). None of this guarantees that QCOM goes lower. But what it does is establish that the risk of shorting at this level is minimal while the potential reward is significant.
Happy trading!
Tom


