Stock market declines are good because they expose the weak hands and highlight potentially strong stocks. Stocks that hold up during a broad market decline show relative strength and this could lead to outperformance when the market turns up again. Xilinx (XLNX) is one such stock because it held up well in August-September and broke out over the last four days.
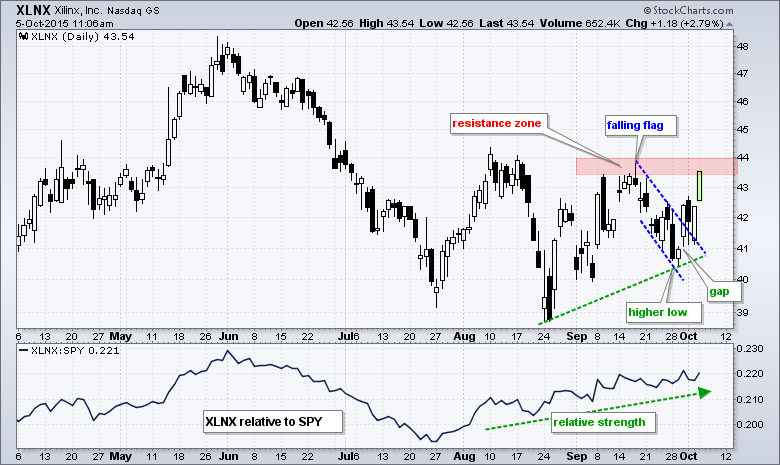
The indicator window shows the stock relative to the S&P 500 SPDR (SPY) using a ratio plot (XLNX:SPY). Even though the stock forged a lower low in late August, the price relative formed a higher low and this shows relative strength. Well, it actually showed less weakness than SPY, which is a form of relative strength.
After surging from late August to mid September, the stock fell back with a falling flag into late September. Despite this decline, the price relative held up and maintained its uptrend. XLNX broke flag resistance with a gap-surge on 20-September and is now poised to challenge the September highs. A breakout here would forge a higher high and signal the start of a bigger uptrend.
******************************************
Thanks for tuning in and have a good day!
--Arthur Hill CMT
Plan your Trade and Trade your Plan
******************************************


