Well, it's another one of those rallies to remember. Is it a return to a new bull market? Some writers have suggested not hitting new highs for 10 months is still a bull market. I would like to use technicals to describe my version of the bull and the bear. Here is a monthly chart of the $SPX going back 25 years.
Let's look at a few indicators again. The RSI, Bollinger Bands, Moving Averages and the PPO.
The RSI is the Relative Strength Indicator. As long as you are above 50, it is a bull market. When it dips below, you are in a bear market. The data point is based on a month end close, and we have had a huge rally so far in March. January closed at 49.94, February closed at 49.40. Bear market signals. Where March closes is pretty important.
Just using price, when the market closed above the 20 MMA (Month Moving Average) shown as an orange line, we have been in a bull market. When below it, we are in a bear market. That sounds easy. Other than one month in 2011, closing below the 20 MMA was a pretty important signal.
Another signal might be shown using the Bollinger Bands (BB) shown in Blue. This is a measure of Standard Deviation. When you reach the top BB line, you are definitely in a bull market until the next time the price moves to the lower BB. When the market starts dipping down and touching the lower BB line, you have started a bear market. That rule would handle the 1995 example where it went below the 20 MMA but did not touch the lower BB. It would also deal with the 2011 price action. Both January and February violated the lower Bollinger Bands.
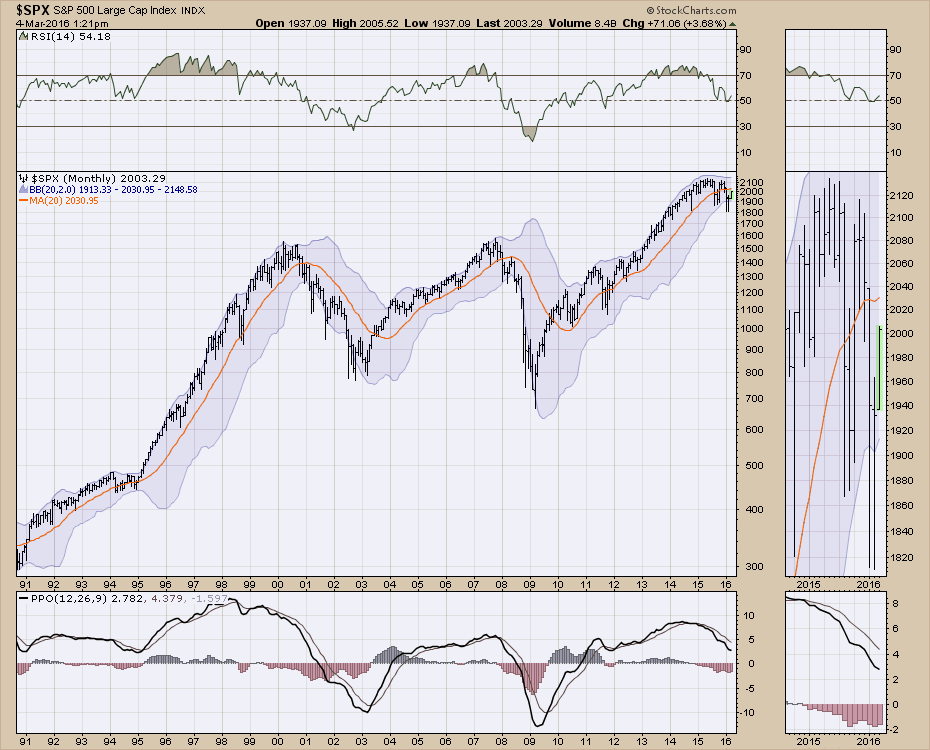 Lastly is the PPO. Downsloping PPO is pretty bearish. The histogram is a good signal. Until it starts to go positive, you have to respect that you are probably in a bear market.
Some of the world's best technicians still believe we are in a bull market. Some of the world's best technicians believe we are in a bear market. The debate rages on. I stand on the bear market side, based on the indicators above. I would change my mind to bullish if March 'closes' above the centre of the Bollinger Bands at 2030. Until then, the January and February closes below 50 on the RSI, the $SPX closing 2 months in a row (look in the zoom box for clarity) below the 20 MMA after touching the lower BB, and a downsloping PPO all make my rules for a bear market. The next few weeks will be important to see if we can test and hold above 2030. In both 2000 and 2008, the 20 MMA was tested as resistance before going lower. Now that we are above 2000, that looks like a possibility again.
Until then,
 Here is the Grizzly that crossed my path on May 09, 2015! Not a bad alarm bell on a monthly chart. I am not expecting to see a bull on the same highway!
Good trading,
Greg Schnell, CMT, MFTA.


