The story that stocks stop at resistance couldn't be demonstrated more clearly than reviewing this Jacob's Engineering (JEC) chart. This stock has stopped 9 times rallying to $45.00 and broke through it once in April 2015 only to gap down below it and get stuck under $45 for a year! Today we are testing it again. With the steadily improving trend on the SCTR, this looks interesting here. The Relative Strength is nearing a 1-year high, so this could pop significantly if it can break out. Why? Institutional firms that scan for new 52-week highs in relative strength would be drawn to the chart. There is no real reason to own this unless it can get through the $45 level, but all of the peers to Jacobs are starting to improve as well.
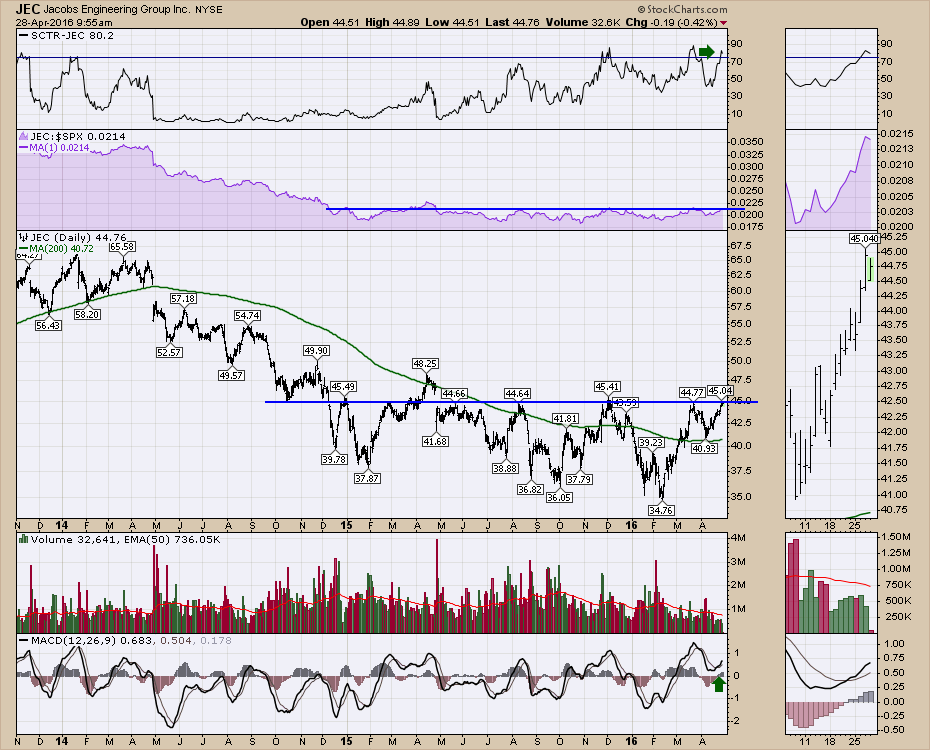 The volume has been weak (about 70% of average) which is concerning, but the turn up on the MACD while above zero is promising. There is a lot of strength in the Industrial sector now and the industrial engineering industry group looks to be following along.
A breakout here would be a beautiful entry. The rhyme of 'the wider the base, the higher the space', looks to be very meaningful in this chart. If it breaks to the upside, it could probably say goodbye to this basing area.
Good trading,
Greg Schnell, CMT, MFTA.
