Jacobs Engineering (JEC) has been correcting for almost 2 years. Recently, JEC broke above a basing pattern and is now back above the 40 WMA. The indicators are showing a nice trend developing. The SCTR ranking shows Jacobs performing in the top 10% of all Large Cap stocks. The Relative Strength trend is breaking out to fresh 16 months highs. On the price plot, we can see the stock surged 4 weeks ago, and then consolidated for three weeks. The volume has been very strong for weeks suggesting institutional accumulation and the PMO continues to climb.
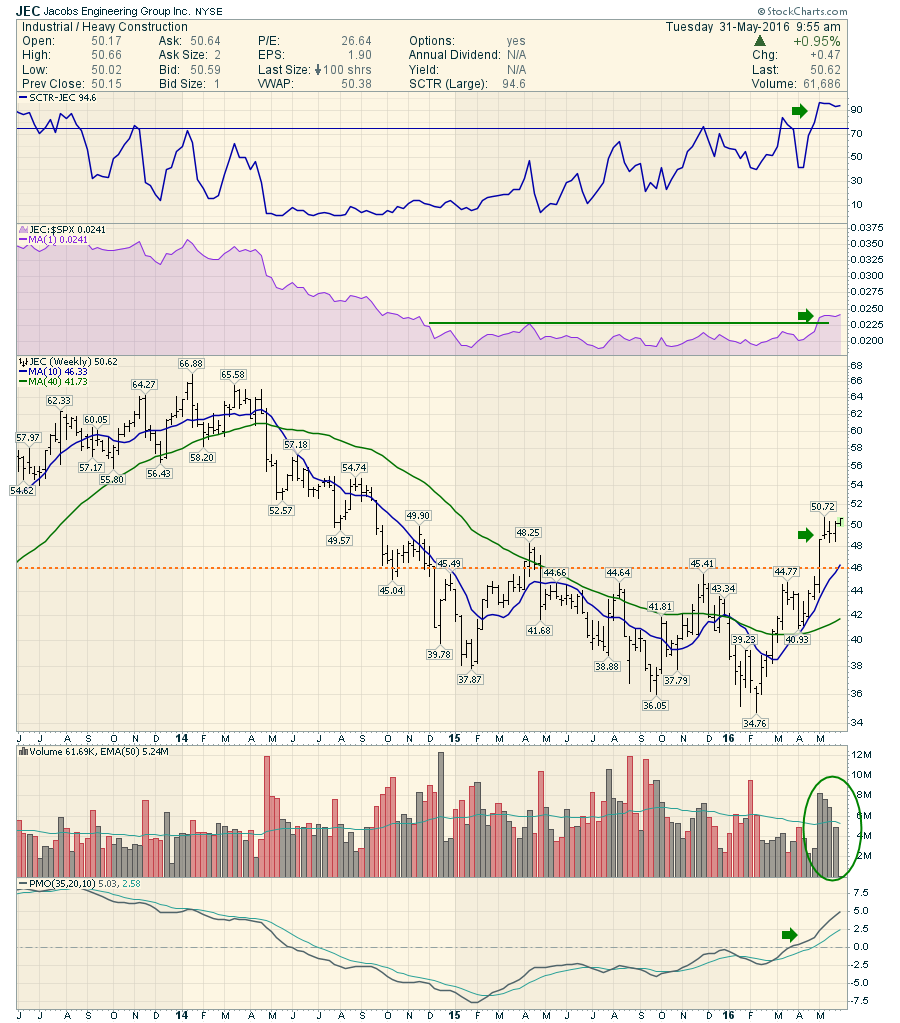 When I reviewed the other companies in the Industrial / Heavy Construction group, very few have a nice strong uptrend into 52-week highs. With support at the recent lows around $48 in this consolidation, this looks like a bull flag. With horizontal support (orange dotted line) and the 10-Week MA at $46, there is lots of support under this chart. But then again, we would expect a stellar engineering company to build a strong base before going higher.
This stock was featured in Don't Ignore This Chart a month ago. Jacobs Engineering Hits That Line In The Screen. We try to feature interesting charts on the Don't Ignore This Chart blog. If you haven't already signed up for email alerts, you can do that by clicking on the Yes button below.
This is a good time to investigate the stocks in the financial sector. I'll be doing an in-depth review on Tuesday's Canadian Technician webinar. You can register by following this link. The Canadian Technician 2016-05-31. Also, if you would like to subscribe to the blogs, click the Yes button immediately below and they will show up in your email inbox. It's usually 1-2 per week.
If you would like to hear more about the precious metals and oil related trades, I focus more time on those during the Commodities Countdown Webinars and there is one on Thursdays at 5 EDT. Click here to register for The Commodities Countdown Webinar 2016-06-02. I look forward to having you join me live or catch the archives by following this link. StockCharts.com Webinar Archives.
Lastly, Chip announced more details about Chartcon 2016 on the recent ChartWatchers newsletter. There is a window of opportunity to have 10 people - just 10 people - join all the StockCharts technicians in California. I mentioned to Chip that I would like to play some golf. So there are a few golf spots (3) available to swing the sticks with me and socialize on the golf course. I'd thoroughly enjoy that. Can you make it to California? Here are the details. See Chips Point #4.
Good trading,
Greg Schnell, CMT, MFTA.


