The S&P 500 continues to battle overhead price resistance that's been well established since closing at its all-time high on May 21, 2015. While a bullish advance typically requires strong and wide participation from many sectors and industry groups, there's one that I'm watching very closely.
Internet stocks ($DJUSNS).
There's a bullish ascending triangle pattern in play on its long-term weekly chart (not shown below) and a breakout on heavy volume would measure to the 1250 level. Currently, the DJUSNS is at 1086 so that would represent an approximate rise of 15% from its current price.
Before we can consider that potential measurement, we need to see a clear breakout above the 1100 level. Here's the visual on the DJUSNS daily chart:
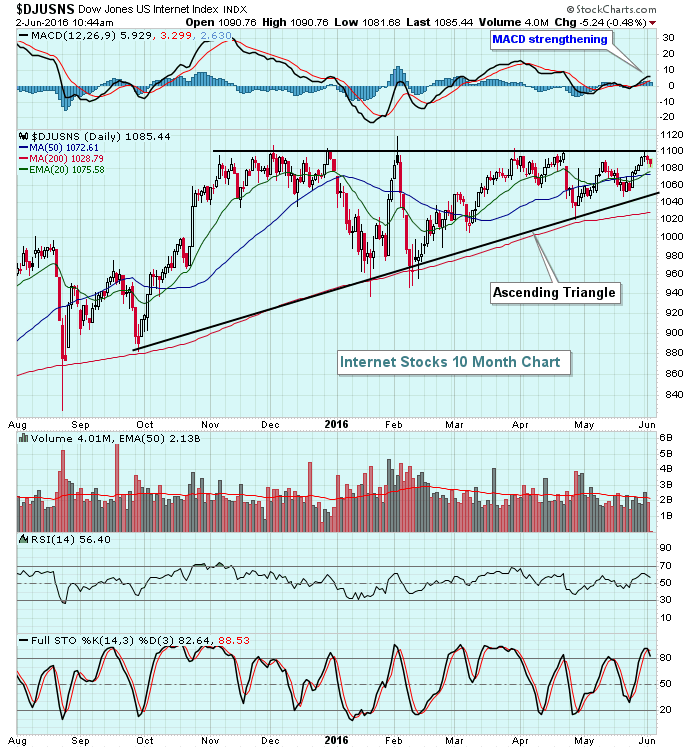 The good news is that momentum is beginning to strengthen so a breakout would likely be sustainable. But I do want to see heavy volume to confirm the breakout after so many attempts to clear 1100.
Happy trading!
Tom


